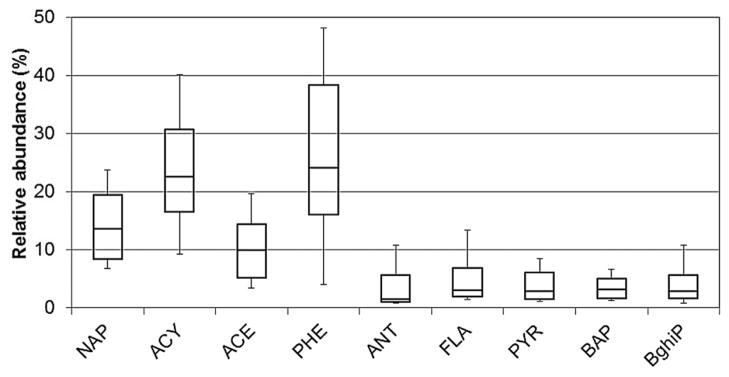
Figure 3.

Polycyclic aromatic hydrocarbon (PAH) profiles in whole fish. Boxplots show 10th, 25th, 50th, 75th, and 90th percentiles for pooled samples. Only compounds with greater than 30% detection frequency are shown. Acronyms of PAHs can be found in Supplemental Data, Table S1.
