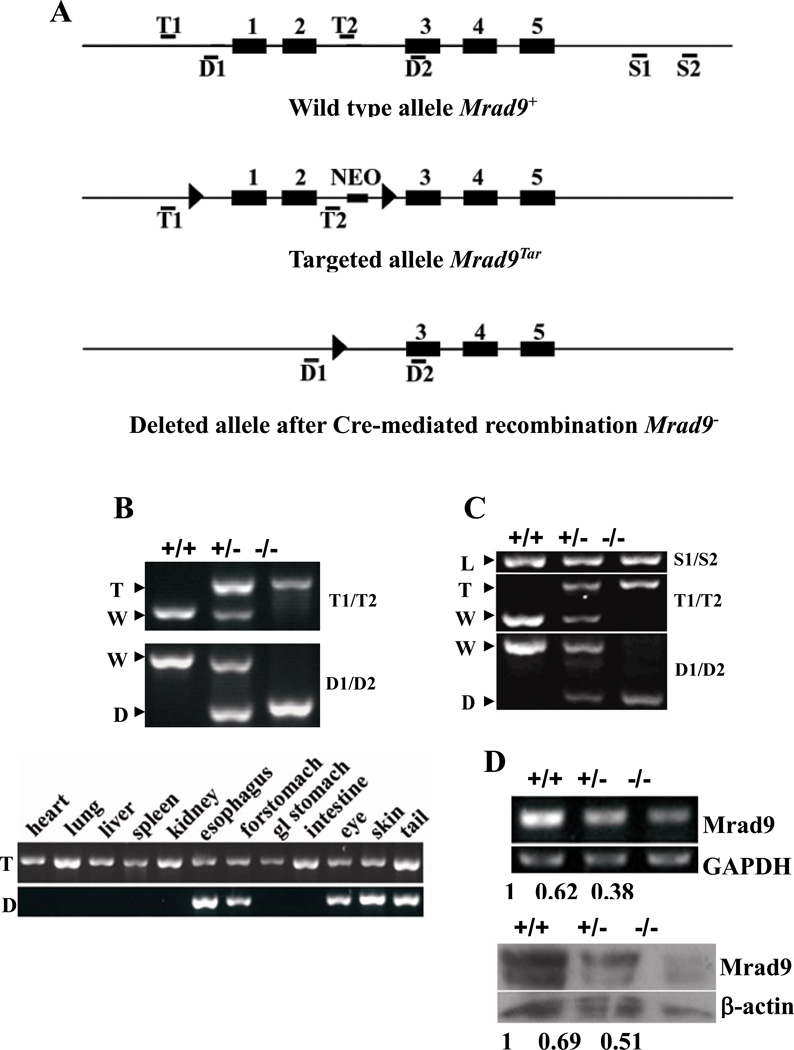
Figure 1. Mrad9 deletion in keratinocytes.
(A) Maps of original, targeted and deleted Mrad9 genomic DNA fragments. Black boxes represent exons, and thin lines represent introns as well as DNA sequences surrounding Mrad9. Locations of primer pairs for detecting the targeting (T1/T2), deletion (D1/D2) of the first two exons and DNA loading control (S1, S2) are marked. (B) PCR genotyping of Mrad9 deletion in mouse tissues. The top panel shows results using primers T1/T2 and D1/D2, and mouse tail DNA as template. The bottom panel is the genotyping results using various mouse tissues. The deleted signature DNA band was only observed in tissues bearing keratinocytes. Gland stomach is represented by gl stomach. (C) PCR-genotyping on skin keratinocytes incubated for three days after isolation. The PCR was semi-quantitative and revealed the Cre efficiency to delete Mrad9. A PCR result using S1/S2 primers is given on the top as the DNA loading control. (D) Semi-quantitative RT-PCR and Western blotting analyses for Mrad9 mRNA and protein levels, respectively, of one-day old mouse pups. Quantitative comparisons to the wild type are listed below the representative experimental results. +/+, +/− and −/− represent Mrad9+/+, Mrad9+/− and Mrad9−/− genotypes, respectively. W, T, D and L on the left of PCR panels indicate signature bands of wild type, targeted, deleted and loading control of Mrad9, respectively.

