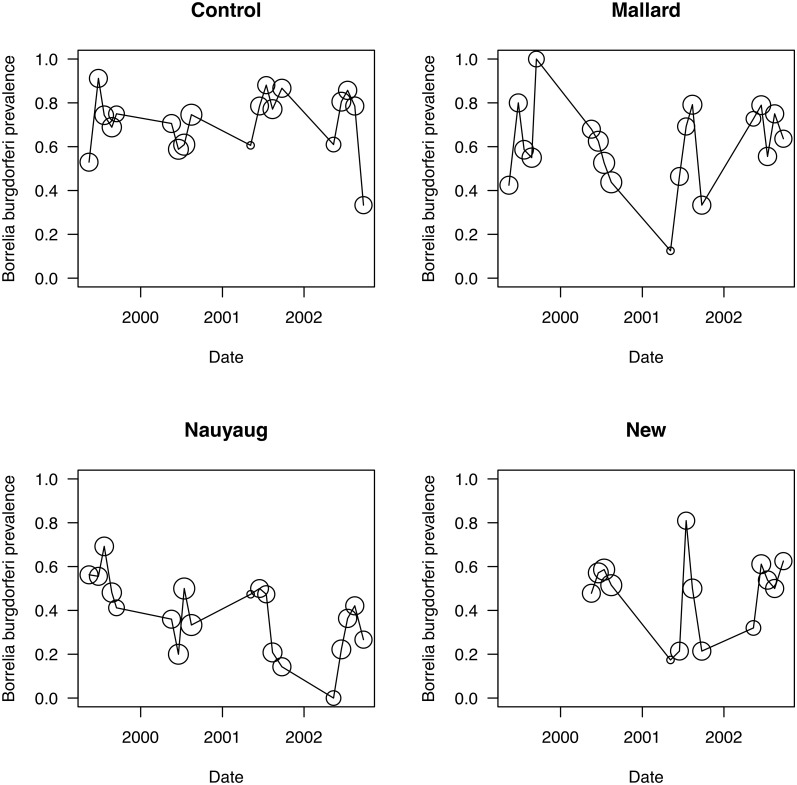
Fig 3. Seasonal and annual variation in Borrelia burgdorferi infection of mice.
Monthly prevalence of Borrelia burgdorferi-infected Peromyscus leucopus mice varied over the four years of the study (1999, 2000, 2001, and 2002) for each of the four areas (Control Area, Mallard Road, Nauyaug Point, New Area). The prevalence is a proportion and therefore does not have units. There are five sampling months within each year (May, June, July, August, September). The size of the circle is proportional to the number of mice on which the prevalence is based (range: 1 to 64). The properties in the New Area were not sampled in 1999. There is no estimate for September 2000 because the mice were not tested for B. burgdorferi infection.

