
Figure 4.
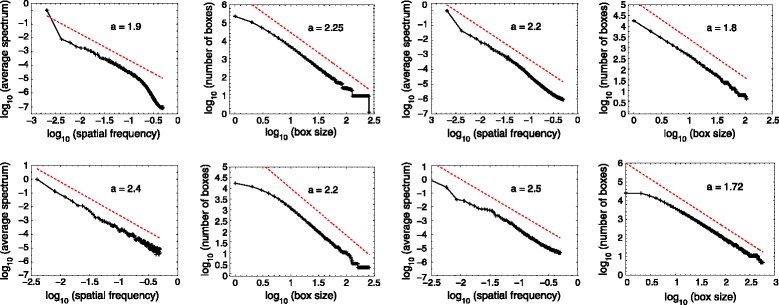
First and second rows: multiscale analysis of RGB-depth images of first and second rows of Figure 3 . First column: average spectrum of RGB luminance image as a function of spatial frequency on a log-log plot. Second column: box counting in the RGB histogram as a function of the box size on a log-log plot. Third column: average spectrum of depth map image as a function of spatial frequency on a log-log plot. Fourth column: box counting in the point cloud of the depth map as a function of the box size on a log-log plot. In each graph, the dotted line with its slope indicated represents a model to appreciate a power-law evolution to match the data. The slopes reveal noninteger exponents for the power-law evolutions matching the data over a significant range of scales. This indicates nontrivial self-invariance of the data across scales, i.e. a fractal organization.