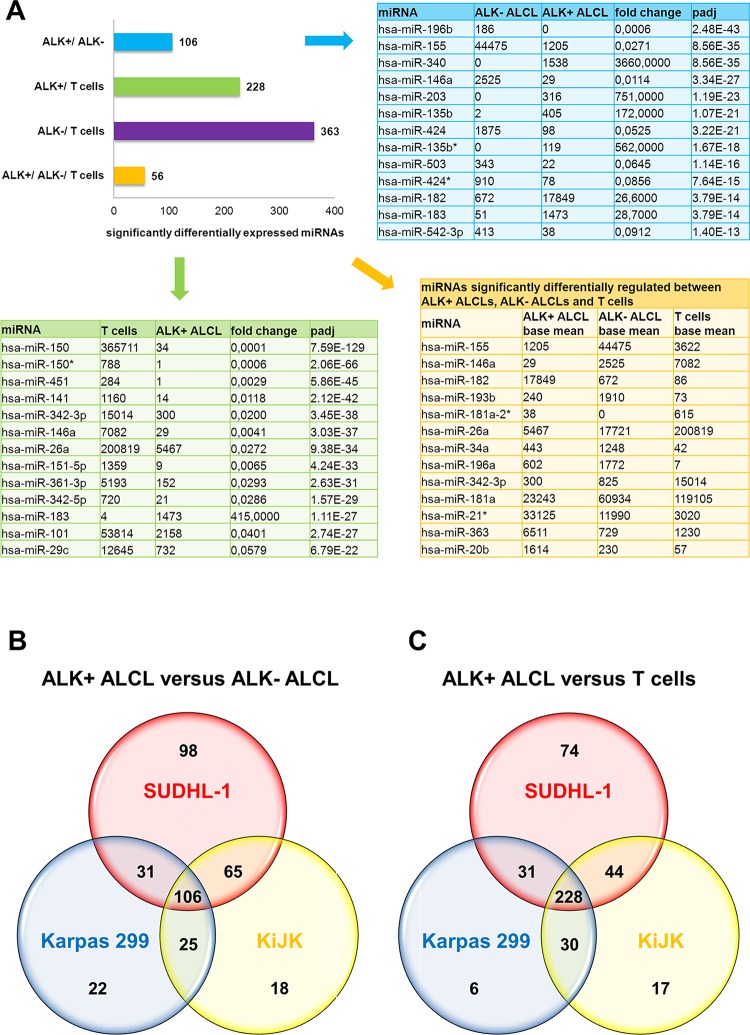
Fig 2. Differentially expressed miRNAs in ALK+, ALK- ALCL and normal T cells.
(A) The bar graph illustrates the numbers of significantly differentially expressed miRNAs between the combined three ALK+ ALCL cell lines SUDHL-1, KiJK and Karpas 299, the ALK- ALCL cell line Mac-1 and normal T cells. The 13 most significantly differentially expressed miRNAs between the investigated ALK- ALCL cell line and the three ALK+ ALCL cell lines (upper right table) and the 13 miRNAs most significantly differentially expressed between the investigated three ALK+ ALCL cell lines and normal T cells (left table) are additionally designated. Data in both tables are depicted as base means of triplicates and fold change and Benjamini-Hochberg corrected p-values (padj) are indicated. Lower right table lists the top 13 miRNAs, which are significant differentially expressed in ALK+ ALCL, ALK- ALCL and normal T cells and present highest differences in expression levels. (B) The Venn diagram represents significant differentially expressed miRNAs in ALK+ and ALK- ALCL in the three ALK+ ALCL cell lines SUDHL-1, KiJK and Karpas 299. The analysis reveals a common profile of 106 deregulated miRNAs. (C) The Venn diagram illustrates significant differentially expressed miRNAs in ALK+ ALCL and T cells in the three ALK+ ALCL cell lines SUDHL-1, KiJK and Karpas 299. The analysis shows a common profile of 228 deregulated miRNAs.

