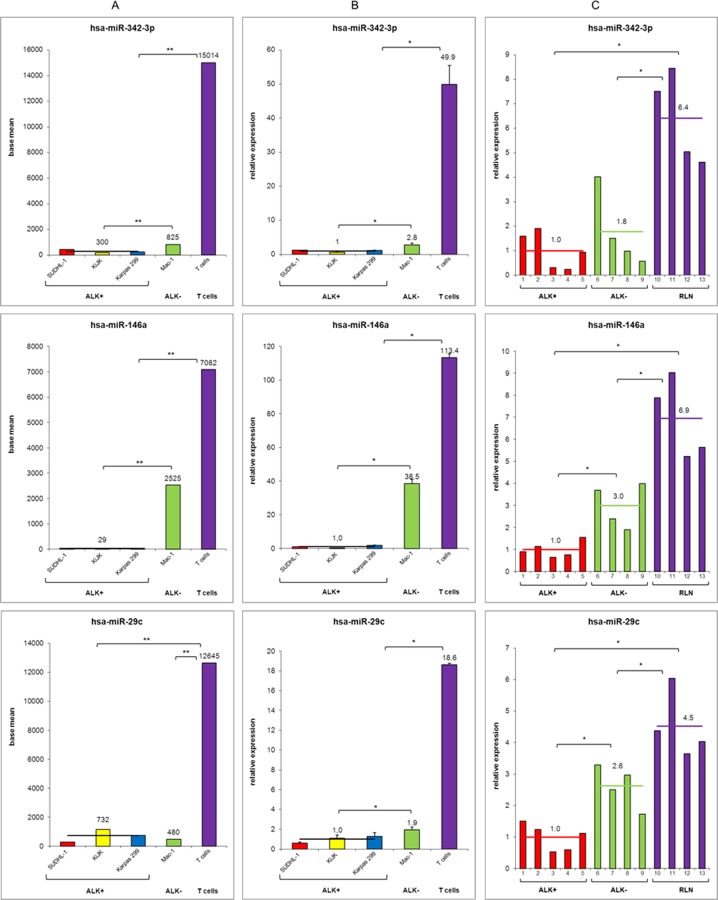
Fig 3. Comparative relative miRNA expression of miRNAs miR-342-3p, miR-146a and miR-29c—deep sequencing, RT-qPCR of cell lines and primary samples.
Quantification of three differentially expressed miRNAs miR-342-3p (upper panel), miR-146a (middle panel) and miR-29c (lower panel) between ALK+ ALCL, ALK- ALCL, T cells (isolated from 3 healthy donors), and normal lymph nodes, respectively. (A) Deep sequencing results. Data are depicted as base mean values from triplicates. (B) RT-qPCR validation analysis. Error bars indicate standard deviation of triplicates for cell lines and number of tested samples, respectively. (C) RT-qPCR validation analysis in primary ALCL cases and reactive lymph nodes (RLN). For RT-qPCR quantification values were normalized to miR-106b and data were analyzed according to the 2-ΔΔCp method. Results are depicted as miRNA levels relative to mean value ALK+ ALCL levels. For statistical analysis of RT-qPCR results a Wilcoxon rank-sum test was used (*p<0.05, **p<0.01).

