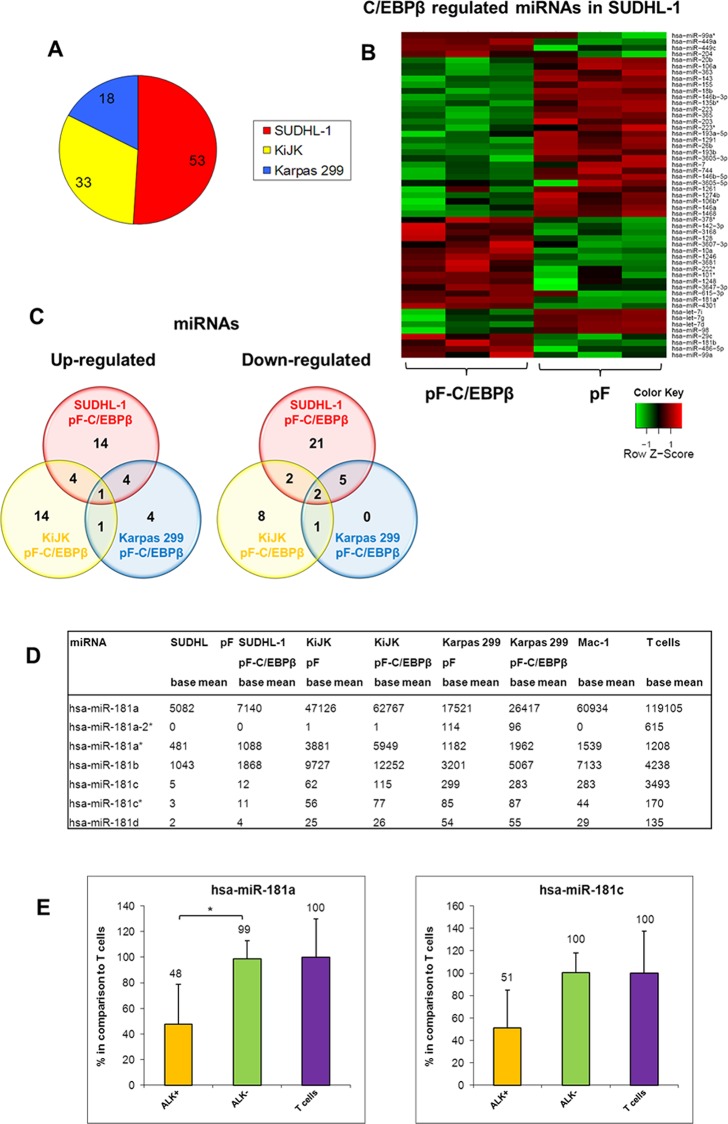
Fig 4. MiRNAs significantly regulated by C/EBPβ knockdown in ALK+ ALCL cell lines.
MiRNA expression profiling of the three ALK+ ALCL cell lines SUDHL-1, KiJK and Karpas 299 with (pF-C/EBPβ) and without (pF) C/EBPβ down-regulation. (A) The circle diagram indicates the number of miRNAs regulated by C/EBPβ knockdown in the particular ALK+ ALCL cell line. (B) C/EBPβ-signature of SUDHL-1 cells derived by C/EBPβ-shRNA. Heatmap shows the expression pattern of the 53 miRNAs significantly regulated by C/EBPβ in SUDHL-1 cells, depicting transduced cells with C/EBPβ-shRNA and controls in triplicates. (C) The Venn diagrams illustrate the number of significantly down-regulated (left) and up-regulated (right) miRNAs in the ALK+ ALCL cell lines after transduction with C/EBPβ-shRNA. (D) The table shows from all miR-181 family members the miRNA expression levels (base mean of triplicates) of the three ALK+ ALCL cell lines SUDHL-1, KiJK and Karpas 299 with (pF-C/EBPβ) and without (pF) C/EBPβ knockdown as well as the ALK- ALCL cell line Mac-1 and normal T cells. (E) RT-qPCR analysis of miR-181a and miR-181c expression in ALK+ (SUDHL-1, KiJK and Karpas 299) and ALK- (Mac-1) ALCL cell lines and T cells. Error bars indicate standard deviation of triplicates for cell lines and number of tested samples, respectively. For RT-qPCR quantification values were normalized to miR-106b and data were analysed according to the 2-ΔΔCp method. Results are depicted as miRNA levels relative to mean value of T cell levels. For statistical analysis of RT-qPCR results a Wilcoxon rank-sum test was used (*p<0.05).

