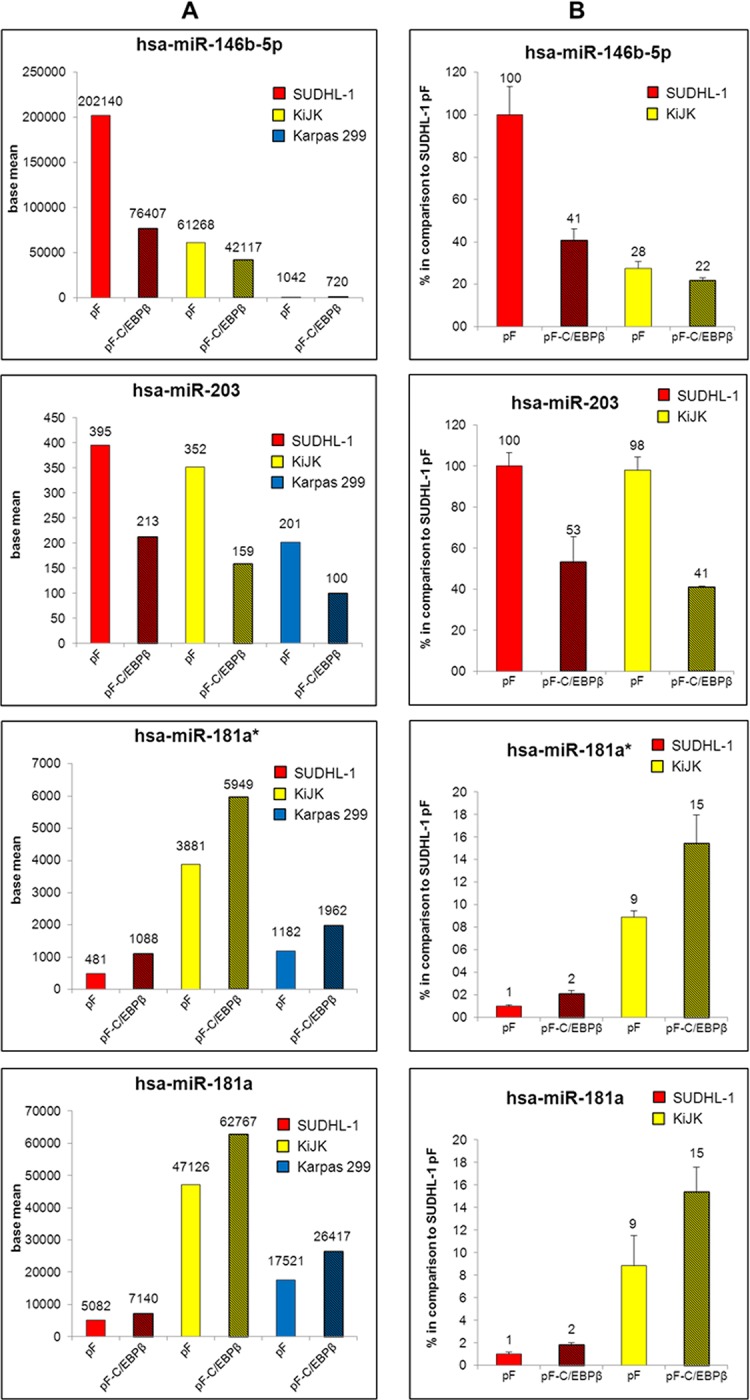
Fig 5. Comparative relative miRNA expression of miRNAs miR-146b-5p, miR-203, miR-181a* and miR-181a after C/EBPβ down-regulation—deep sequencing and RT-qPCR of ALK+ ALCL cell lines.

Quantification of three by C/EBPβ knockdown significantly regulated miRNAs miR-146b-5p (upper panel), miR-203 (second panel), miR-181a* (third panel) and additionally miR-181a (lower panel), in ALK+ ALCL cell lines. (A) Deep sequencing results of ALK+ ALCL cell lines transduced with pF or pF-C/EBPβ shRNA. Results are depicted as base mean values from triplicates. (B) RT-qPCR analysis of miRNAs 146b-5p, 203, 181a* and 181a in pF and pF-C/EBPβ (shaded) transduced ALK+ ALCL cells four days after infection. Values were normalized to RNU6B and data were analysed according to the 2-ΔΔCp method. Results are depicted as miRNA levels relative to untreated SUDHL-1 cells. Error bars indicate standard deviation of triplicates.
