
Figure 2.
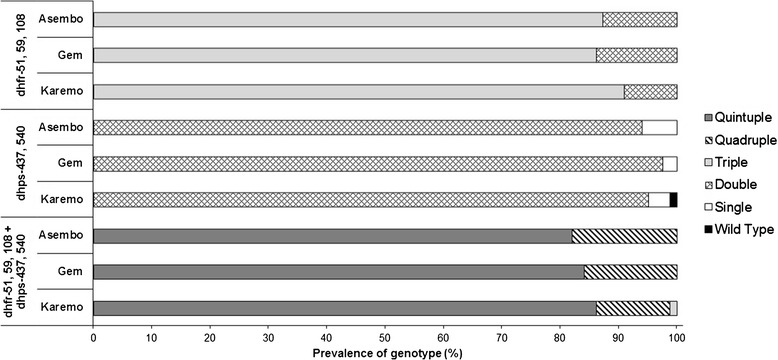
Comparison of prevalence SP drug resistance genotypes among study areas. Dhfr, dhps, and combined dhfr/dhps genotypes by study area. Statistical analysis performed using Chi-square tests. *p <0.05 difference in prevalence mutations between study areas.