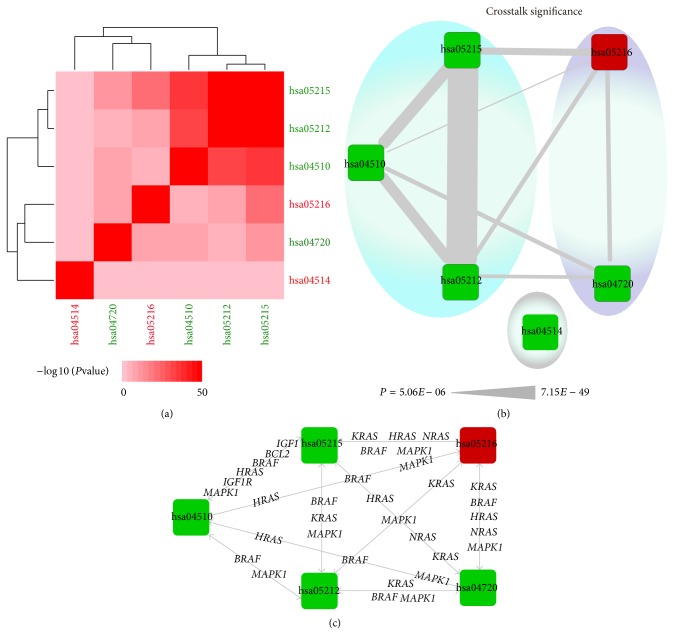
Figure 2.
Pathway crosstalk analysis and functional clustering. (a) Hierarchical clustering of dysregulated pathways based on −log 10 P values of their interactions; stronger interactions are represented by a more intense color. (b) Crosstalk between dysregulated pathways. Rectangular nodes represent pathways and edges denote crosstalk between two pathways, with wider edges representing greater interaction between two pathways. Two clusters (blue and purple) were identified; one pathway did not cluster with the others (grey). (c) Crosstalk between pathways mediated by MG-related genes.

