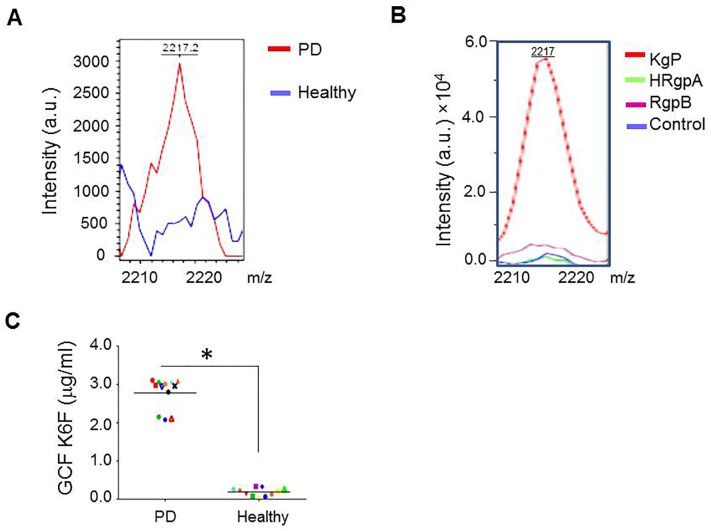
Fig 1. MALDI-TOF mass spectrometry profiles of GCF and rat GEC culture supernatants and K6F concentrations in GCF from PD patients and healthy volunteers.
A: The proteins in GCF were extracted from the strips into the assay buffer and analyzed by MALDI-TOF mass spectrometry in arbitrary units (a.u.). The profile of GCF from PD patients on K6F peptides (red line) was superimposed onto that of healthy subjects (blue line). B: Profile of K6F detected in rat GEC supernatants. Activated gingipains were incubated with primary cultures of rat GECs, and supernatants were collected. A peak of K6F was detected in supernatants from rat GECs treated with Kgp (red line) at a molecular weight of 2217. C: GCF samples were collected and K6F titers were quantitatively measured by ELISA. Chart shows a dot plot of K6F levels in individual patients. Experiments were performed two times in triplicate. *P<0.001 versus PD.

