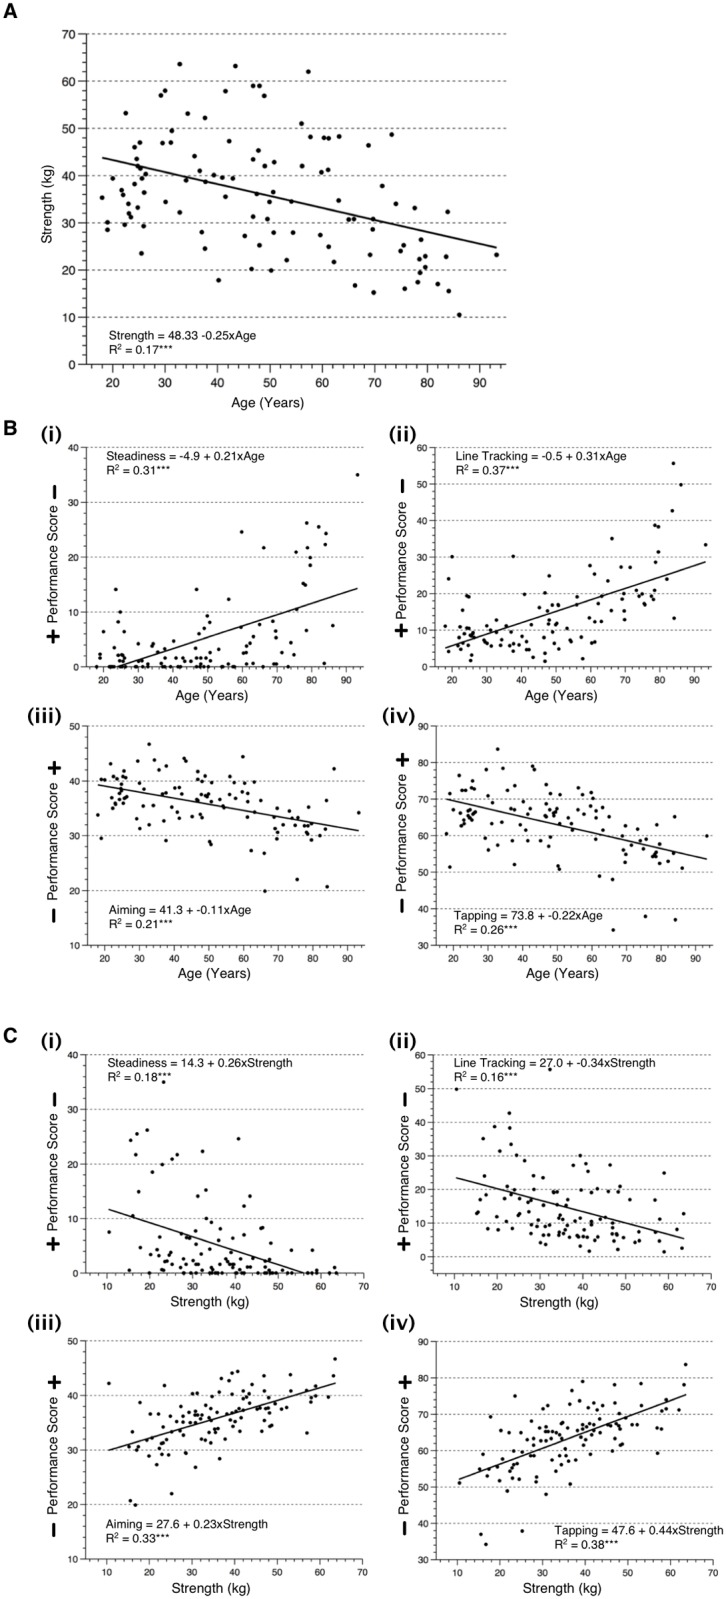
Fig 2. Nine scatterplots to illustrate the relationships between: (A) age and grip strength; (B) the dependent measures of hand dexterity and age; and (C) the dependent measures of hand dexterity and strength.

Also shown on each plot is the best-fit simple regression line and the linear regression equation (***p<0.001, n = 107). NB: Dependent measures are represented in the following order: (i) steadiness; (ii) tracking; (iii) aiming; (iv) tapping; with the direction of a positive/negative performance score indicated.
