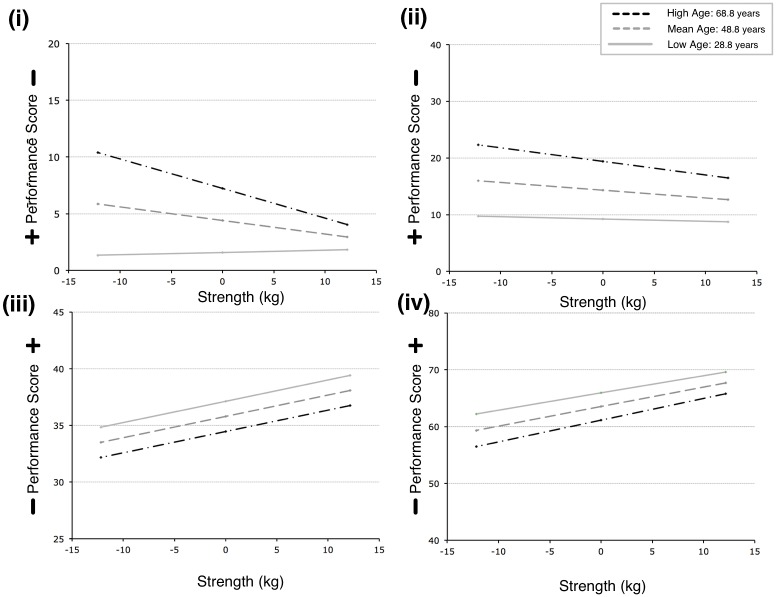
Fig 4. Four plots illustrating the simple slope post hoc interaction analyses: (i) strength and steadiness; (ii) strength and line tracking; (iii) strength and aiming; (iv) strength and tapping.
Data plotted are mean centred age ± 1 SD, where minus one standard deviation represents younger adults (Low age) and plus one standard deviation represents older adults (High age). Note that the direction of positive performance score is indicated.

