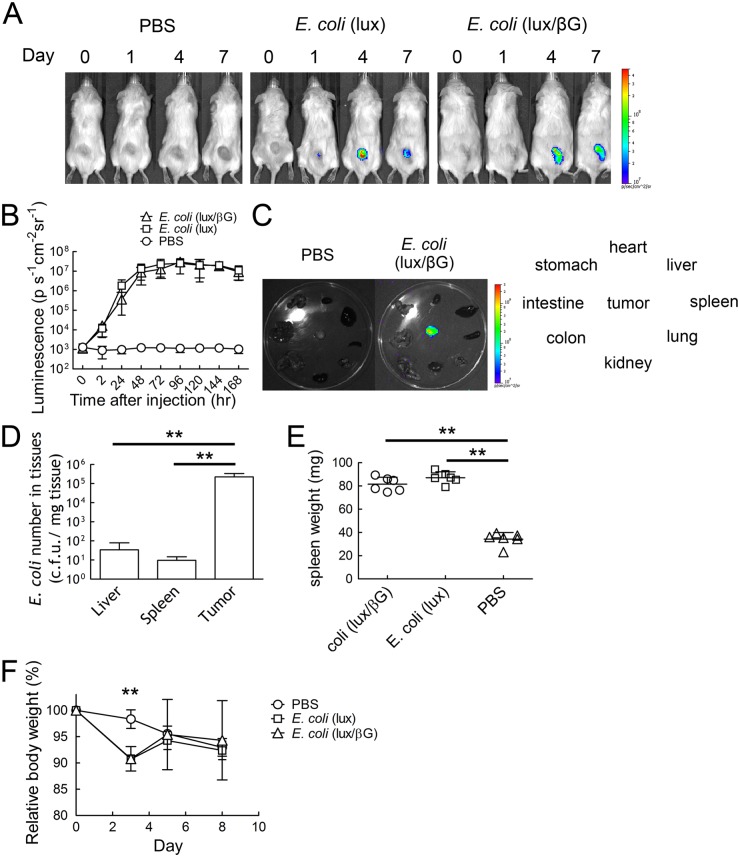
Fig 4. In vivo localization of E. coli in HCT116 tumors.
PBS or 4 x 10⁷ c.f.u. E. coli (lux) or E. coli (lux/βG) were i.v. injected into mice bearing 150 mm3 HCT116 tumors. (A) Luminescence images were captured on an IVIS Spectrum on days 0, 1, 4 and 7 (n = 6). (B) The region of the interesting (ROI) of mice treated as in panel A on different days were analyzed (n = 6). The Y-axis indicates the luminescence intensity. Bars, s.d. (C) The luminescence of organs (clockwise order: heart, liver, spleen, lung, kidney, intestine, colon, and stomach) and tumors isolated from mice treated with PBS or 4 x 10⁷ c.f.u. E. coli (lux/βG) were imaged on an IVIS spectrum on day 8. Bars, s.d. ** P < 0.005. (D) E. coli (lux/βG)-injected mice were sacrificed on day 8. Liver, spleen and tumor tissues were homogenized and spread on LB agar plates to count the bacterial colonies (n = 6). Bars, s.d. ** P < 0.005. (E) The spleen weight on day 8 and (F) relative body weight of mice during the experiment were measured (n = 6). Bars, s.d. ** P < 0.005.

