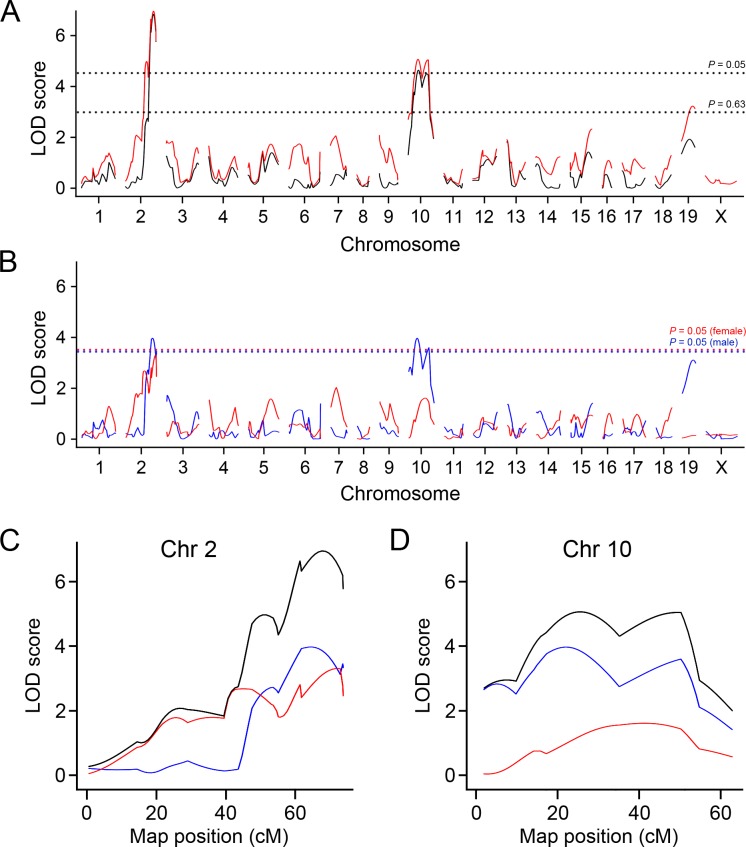
Fig 2. LOD curves for atherosclerotic plaque size at the arch.
(A) LOD curves for the arch lesion with sex as an additive covariate (black line) and as an interactive covariate (red line). X-axis represents chromosome number and y-axis represents the LOD score. The horizontal dashed lines represent the thresholds for significant QTL (P = 0.05) and suggestive QTL (P = 0.63) in the sex-interactive model. (B) LOD curves for arch lesion in males (blue line) and females (red line). The horizontal dashed lines represent the thresholds for significant QTL (P = 0.05) in males (blue) and females (red). (C and D) LOD curves for the arch lesion on Chr 2 (C) and Chr 10 (D) with sex as an interactive covariate (black), in males (blue) and in females (red). X-axis represents positions on chromosome (cM) and y-axis represents the LOD score.

