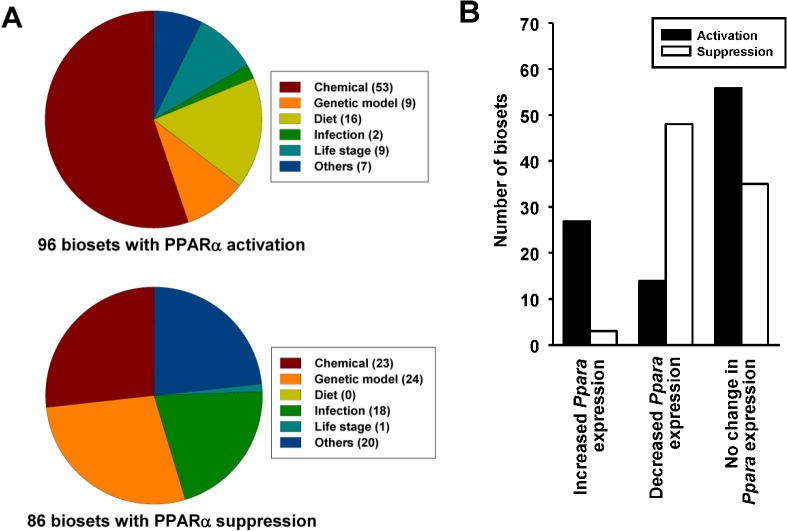
Fig 5. PPARα activation or suppression in a mouse liver compendium.
A. Summary of PPARα activation or suppression. The PPARα signature was compared to ~1850 biosets using the Running Fisher’s test. The number of biosets with a p-value ≤ 10-4 for either activation or suppression in the indicated categories is shown. B. Relationships between Ppara expression changes and predictions of PPARα activity. The biosets were divided into those in which Ppara mRNA expression was increased, decreased or exhibited no change (∣fold-change∣ ≥ 1.2). Predictions of the number of biosets for PPARα activation or suppression are shown for the three groups.

