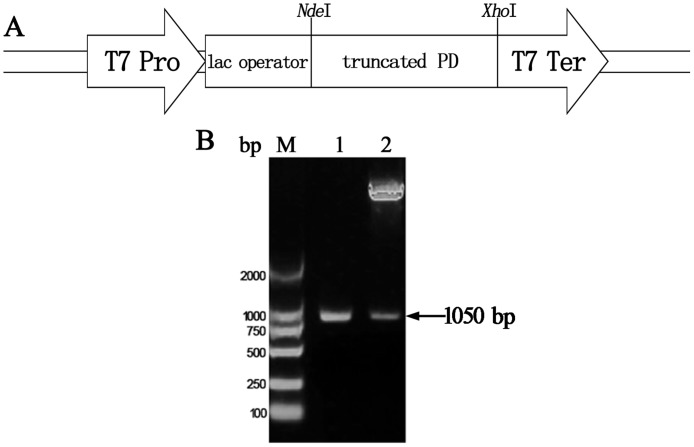
Fig 1. Schematic diagram of the truncated PD gene in the pET43.1a expression vector, PCR amplification of the truncated PD gene, and restriction endonuclease analysis of the expression plasmid.
(A) Schematic diagram of the expression plasmid. (B) Agarose gel electrophoresis of the truncated PD gene amplified by PCR and restriction endonuclease analysis of the plasmid. Lane M, DNA marker DL2000; lane 1, truncated PD gene amplified by PCR; lane 2, expression plasmid digested with NdeI/XhoI. (T7 pro, T7 promoter; T7 ter, T7 terminator).

