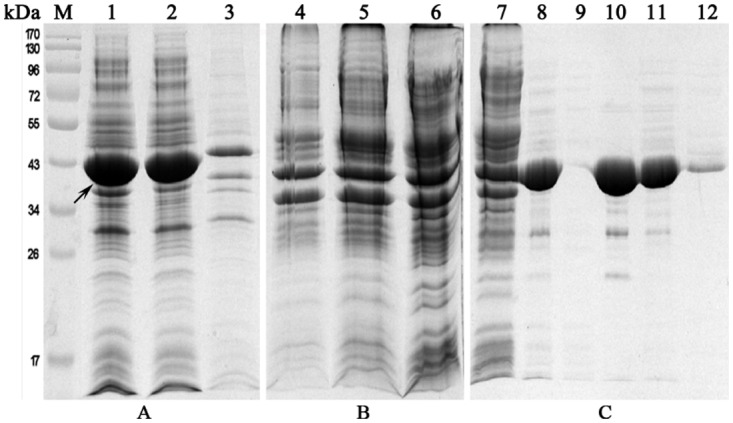
Fig 3. SDS-PAGE analysis of the large-scale PD expression and purification steps.

(A) Distribution of PD in induced bacteria after large-scale expression. Lane M, pre-stained protein molecular weight marker; lane 1, total bacterial proteins after sonication; lane 2, soluble fraction of the sonicate; lane 3, insoluble fraction of the sonicate. (B) (NH4)2SO4 precipitation. Lanes 4–6, precipitated proteins at 33, 40 and 45% (NH4)2SO4 saturation, respectively. (C) Fine purification of PD by DEAE chromatography. Lane 7, precipitated proteins at 45% (NH4)2SO4 saturation; lane 8, soluble fraction at 45% (NH4)2SO4 saturation following dialysis; lane 9, flow-through; lane 10, elutes washed with 100 mM NaCl in buffer A; lane 11, elutes washed with 200 mM NaCl in Buffer A; lane 12, elutes washed with 400 mM NaCl in Buffer A. Arrows indicate PD.
