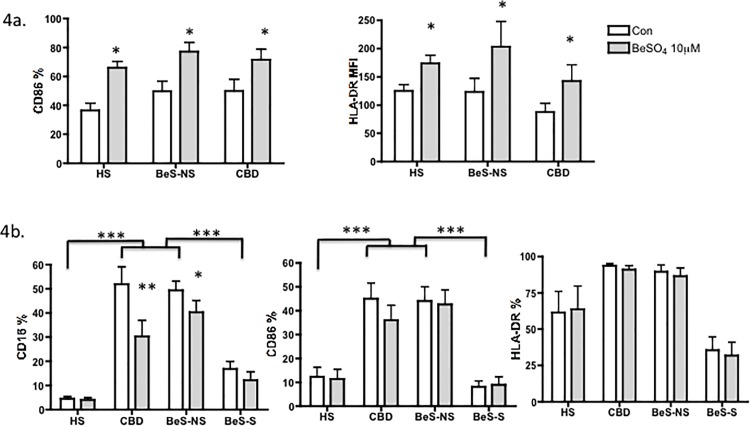
Fig 4. Expression of phenotypic makers on monocytes and AMs with or without 10μM BeSO4 stimulation.
4a. Expression of phenotypic makers on monocytes. Upper Left. monocytes CD86(%); Upper Right. monocytes HLA DR MFI. 4b. Expression of phenotypic makers on AMs. Lower Left. AMs CD16 (%); Lower middle. AMs CD86(%); Lower Right. AMs HLA DR(%). Bars in a and b show the mean +/- SEM. *p<0.05, **p<0.01, ***p<0.001.

