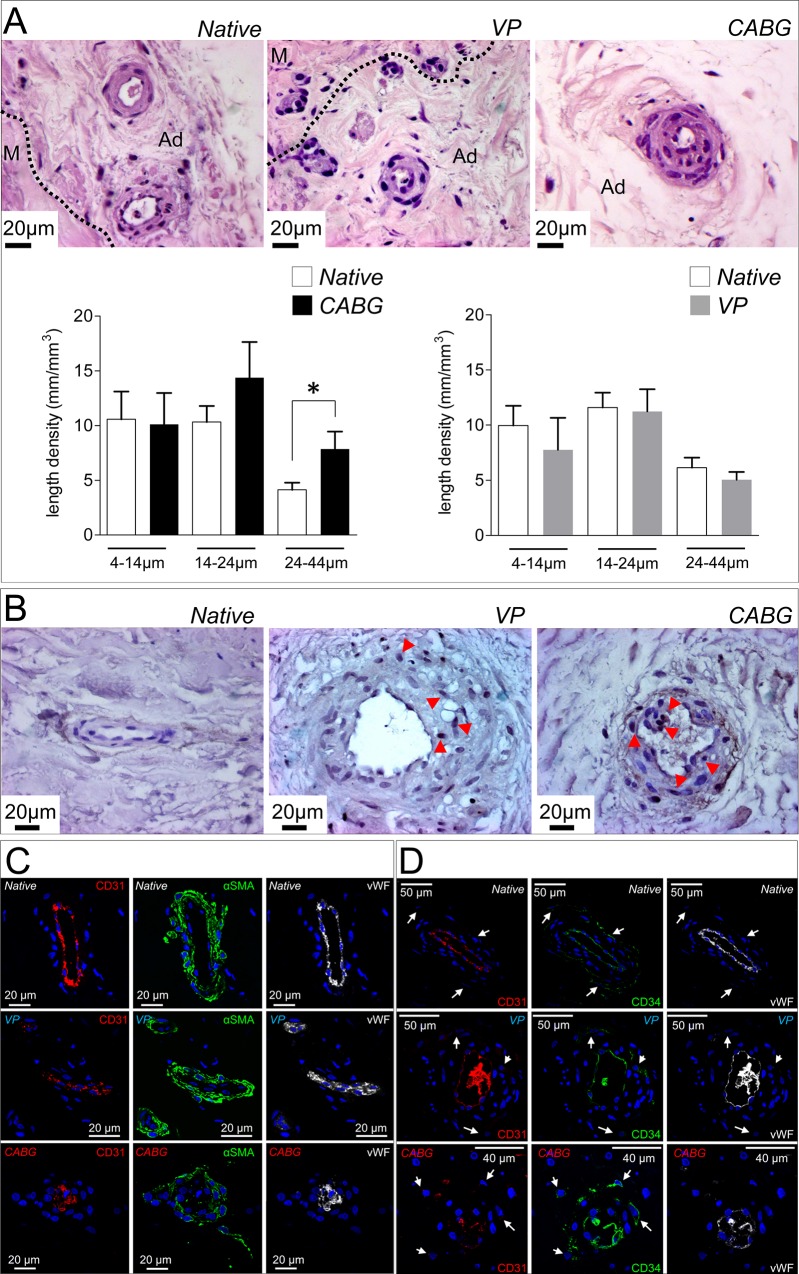
Fig 4. Histological appearance and marker analysis in SV vasa vasorum.
(A) Representative micrographs of the adventitial layer in Native, VP and CABG veins stained with H&E. The boundary between the media (M) and the adventitia layers (Ad) is shown. Bar graphs indicate quantification of the vasa vasorum length density. The 24–44 μm category was significantly increased in CABG samples. * indicates P < 0.05 by paired t-test (n = 12 CABG samples; n = 12 VP samples). (B) Detection of Ki-67+ cells in the vasa vasorum of SV samples showing more abundant positive cells in adventitial vessels of CABG pressure stimulated veins (red arrowheads). Triple staining with CD31/αSMA/vWF (C) or CD31/CD34/vWF antibodies (D) to detect SMCs and ECs or SVPs in the vasa vasorum. An overall decrease in EC markers expression as well as α-SMA in the surrounding SMCs was observed in CABG samples. In addition, these vessels appeared remarkably de-structured.

