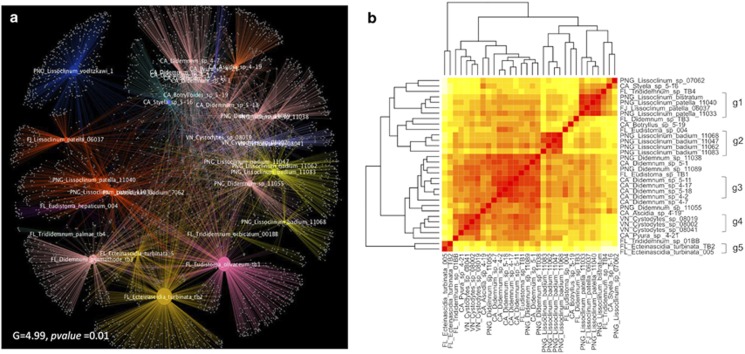
Figure 3.
Host specificity of ascidian microbiomes assessed by UniFrac and network-based analyses. (a) Cytoscape network of ascidian microbiomes showing a significant clustering by host species. Categories are reflected in the color scheme, where identical species (defined in map 1 of Supplementary Table S5) have identical colors. (b) Unifrac-based hierarchical clustering of ascidians plotted in two symmetrical dimensions. Groups at the right most portion indicate the grouping used for the analysis of species-specific components of the microbiomes.

