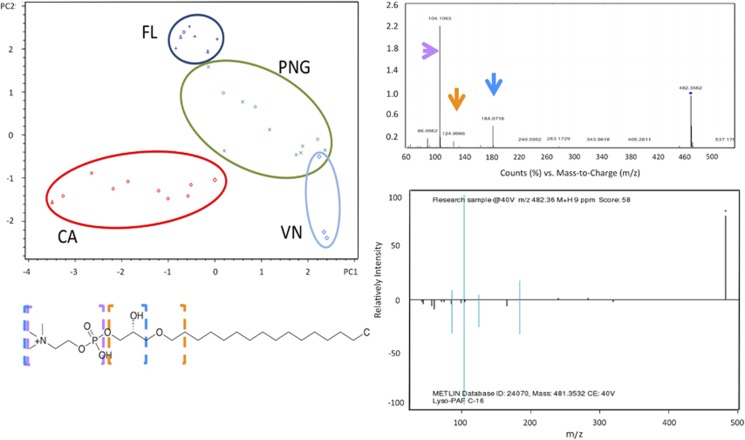
Figure 5.
Geographical clustering of ascidian samples due to lipid components. (a) PCA plot of ascidians in the first two dimensions showing clustering by geographical location (FL, Florida; PNG, Papua New Guinea; VN, Vanuatu; CA, California). (b) Example of how lipids were identified in this study. LC-MS/MS analysis and comparison of fragmentation patterns and accurate mass to lipids in METLIN database allowed assignment of specific fragments (colored arrows) to their complementary molecular components within lipid structures (colored boxes surrounding lipid molecule). Although these fragments do not absolutely confirm lipid identity, they provide high confidence that the compound falls within the lipid family as shown. See Supplementary Figures S5 and S6 for more details of lipid analysis.

