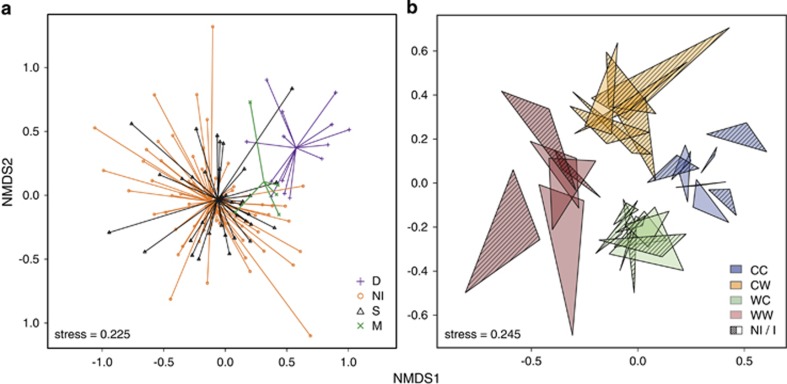
Figure 4.
NMDS plots of Bray-Curtis distances between the microbial communities (day 0 excluded): (a) grouped by oyster condition and (b) showing temporal stability and effects of treatments (alive oysters only). Each triangle represents an oyster with vertices representing days 3, 5 and 7 after the onset of experiment. CC, cold acclimated; CW, warm stressed; WC, cold-stressed; WW, warm-acclimated; NI, non-infected; S, survivors; M, moribund; D, dead.

