Figure 4.
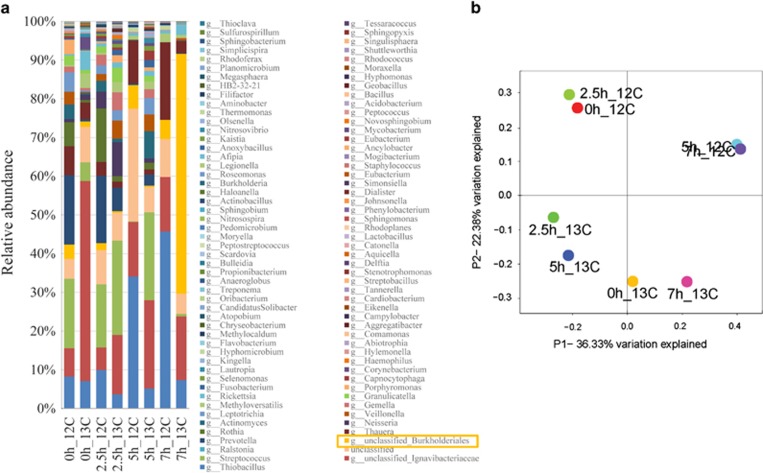
(a) Relative abundance of taxonomic classification of microbial community at the family level in the 12C- and 13C-DNA fractions of 13C6-phenol incubated biosludges. Taxonomic assignment was carried out using the Greengenes 16S rRNA database. DNA-SIP experiments indicated that Burkholderiales spp. were dominant species in the 13C-DNA fraction after 7 h phenol degradation, suggesting they were key phenol degraders in situ. Sample code example: 2.5h_13C means the 13C-DNA fraction at time t=2.5 h degradation shown in Figure 2. (b) Bacterial communities during phenol degradation are clustered using PCoA of the Bray-Curtis matrix. The percentage of variation explained by the principal coordinates is indicated on the axes.

