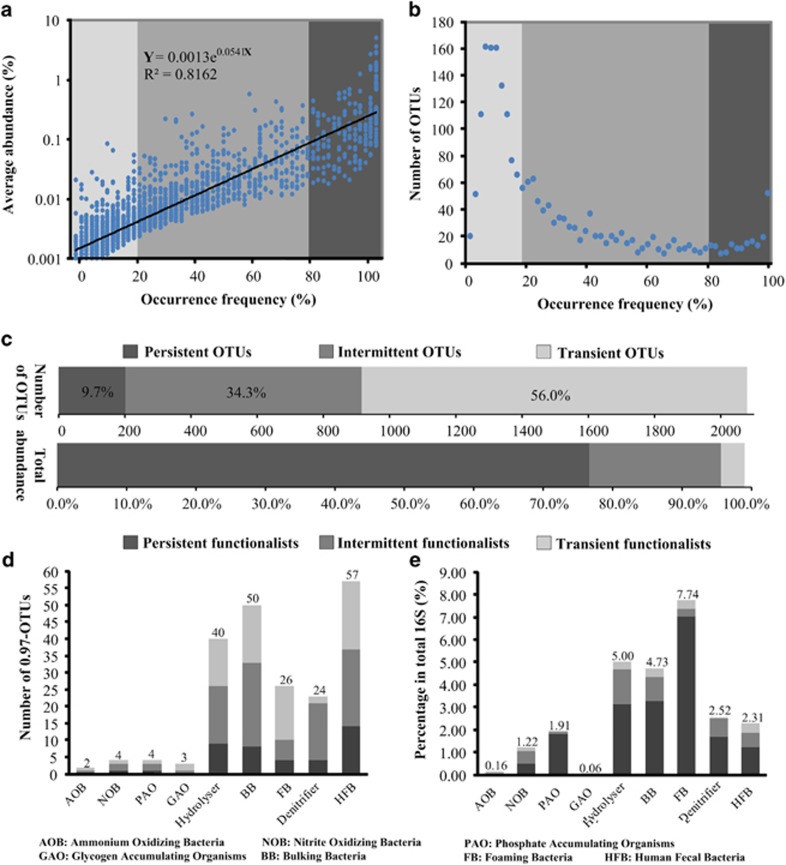
Figure 2.
Defining the 5-year activated sludge microbiome at the Shatin WWTP. The mean abundance of OTUs (a) and the number of OTUs (b) are shown relative to the 0.97-OTU's percentage occurrence (X axis). The occurrence frequency was calculated by dividing the number of months in which an OTU was detected by the number of total months. The abundance and the number of OTUs of different occurrence frequencies (Persistent, Intermittent and Transient) are shown in (c). Diversity (d) and mean abundance (e) of potential functional bacterial groups (in the monthly samples they were detected) of different occurrence frequencies (see Supplementary Table S4 for the list of the functional bacteria).

