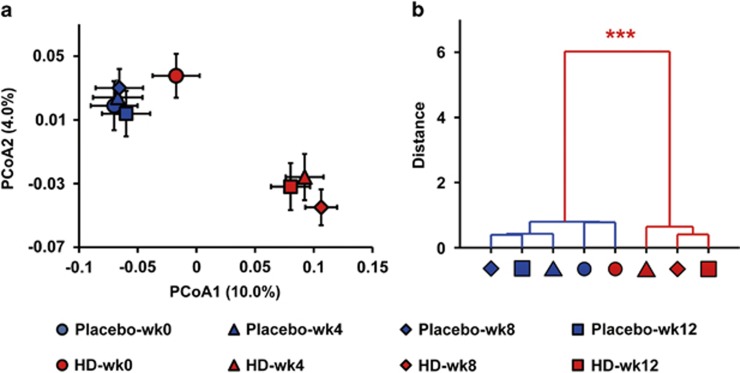
Figure 3.
Trajectory of the gut microbiota in T2D patients treated with HD GQD and placebo at weeks 0, 4, 8 and 12. (a) Unweighted Unifrac PCoA of gut microbiota based on the OUT data from the second pyrosequencing run. (b) Clustering of gut microbiota based on mahalanobis distances calculated with multivariate analysis of variance (MANOVA). Each point represents the mean principal coordinate (PC) score of all patients in a group at one time point, and the error bar represents the s.e.m. Placebo: n=36; HD: n=36. ***P<0.0001.

