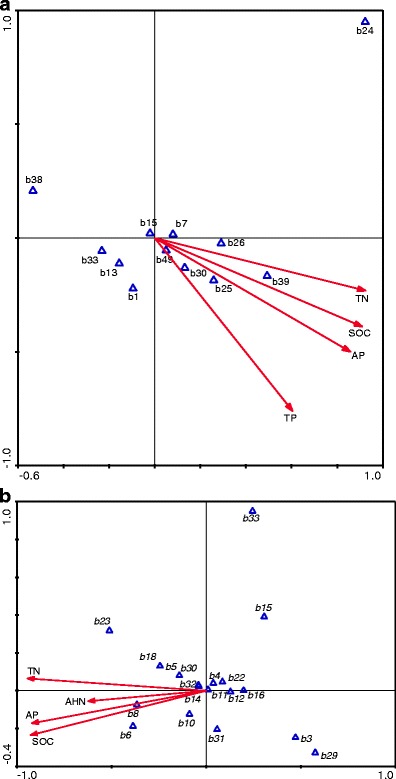
Fig. 5.

CCA biplot depicting the relationship between a bacterial and b fungal ribotypes with regard to selected soil properties. Selected soil properties effects are represented by vectors. Ribotypes are represented by triangles and named according to the migration position on the gels
