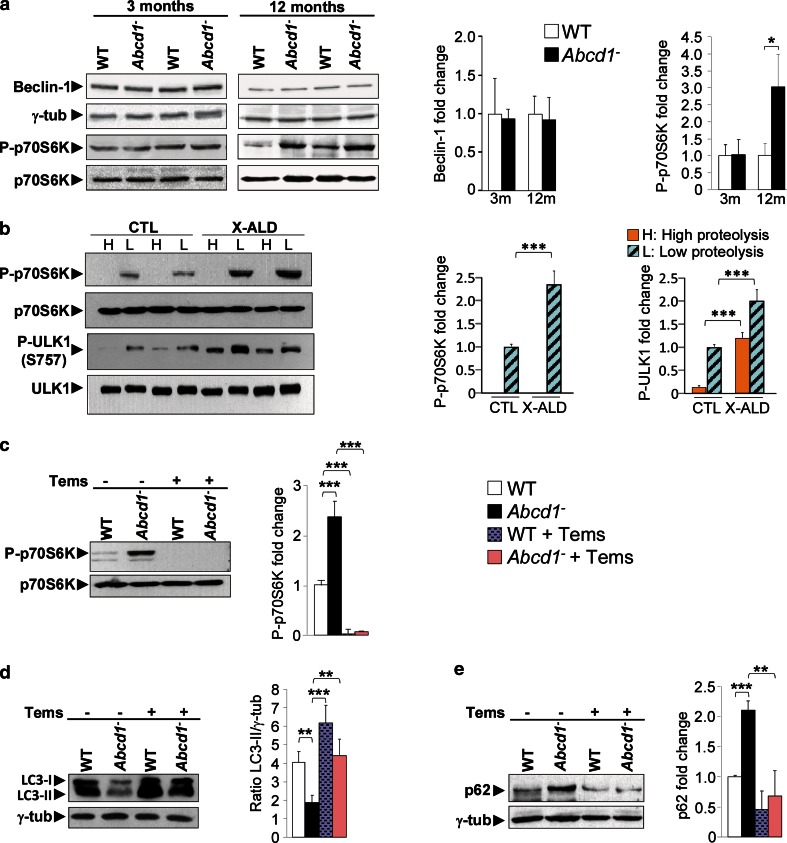
Fig. 4.
Temsirolimus inhibits mTOR and restores autophagy in spinal cord from Abcd1 − mice. a Representative immunoblots for Beclin-1 and total p70S6 K and its phosphorylated form (P-p70S6 K) in spinal cords from 3- and 12-month-old WT and Abcd1 − mice. The histograms on the right show the Beclin-1 levels normalized respect to γ-tub and the P-p70S6 K/p70S6 K ratios relative to their respective WT values. b Representative immunoblots for p70S6 K and ULK1 and their phosphorylated forms (P-p70S6 K and P-ULK1) in extracts from control (CTL) and patients´ (X-ALD) fibroblasts incubated under high (H) and low (L) proteolysis conditions. The histograms on the right show P-p70s6 K/p70S6 K and P-ULK1/ULK1 ratios relative to CTL fibroblasts under low proteolysis conditions. Representative immunoblots for p70S6 K and P-p70S6 K (c), LC3-II (d) and p62 (e) in spinal cords of 14-month-old WT mice untreated (WT) or treated with temsirolimus (WT + Tems) and Abcd1 − mice untreated (Abcd1 −) or treated with temsirolimus (Abcd1 − + Tems). In c and d, the histograms on the right show, respectively, P-p70S6 K/p70S6 K ratios relative to WT values and the LC3-II levels normalized respect to γ-tub. In e, the histogram on the right shows the levels of p62 normalized respect to γ-tub and relative to untreated WT mice. All values are expressed as mean ± SD (n = 4 samples per genotype and condition in b; n = 6 samples per genotype and condition in a and c–e; *p < 0.05, **p < 0.01 and ***p < 0.001, one-way ANOVA followed by Tukey’s hsd post hoc test)

