
Fig. 2.
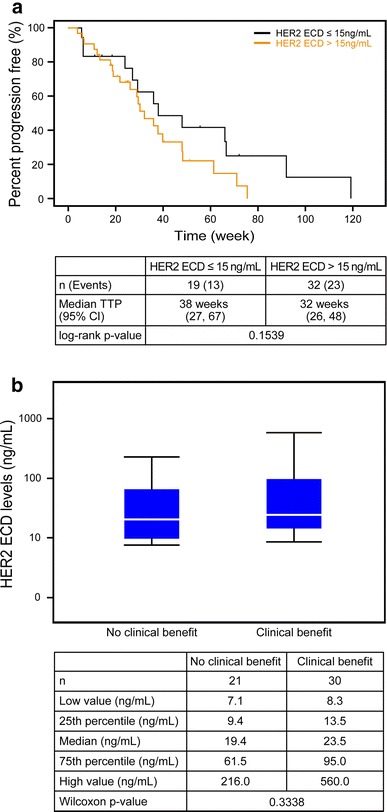
Baseline serum concentration of HER2 ECD according to response to lapatinib plus capecitabine. a Kaplan-Meier plots stratified by HER2 ECD status; b box plot of HER2 ECD level according to the clinical benefit
Official websites use .gov
A
.gov website belongs to an official
government organization in the United States.
Secure .gov websites use HTTPS
A lock (
) or https:// means you've safely
connected to the .gov website. Share sensitive
information only on official, secure websites.
Baseline serum concentration of HER2 ECD according to response to lapatinib plus capecitabine. a Kaplan-Meier plots stratified by HER2 ECD status; b box plot of HER2 ECD level according to the clinical benefit