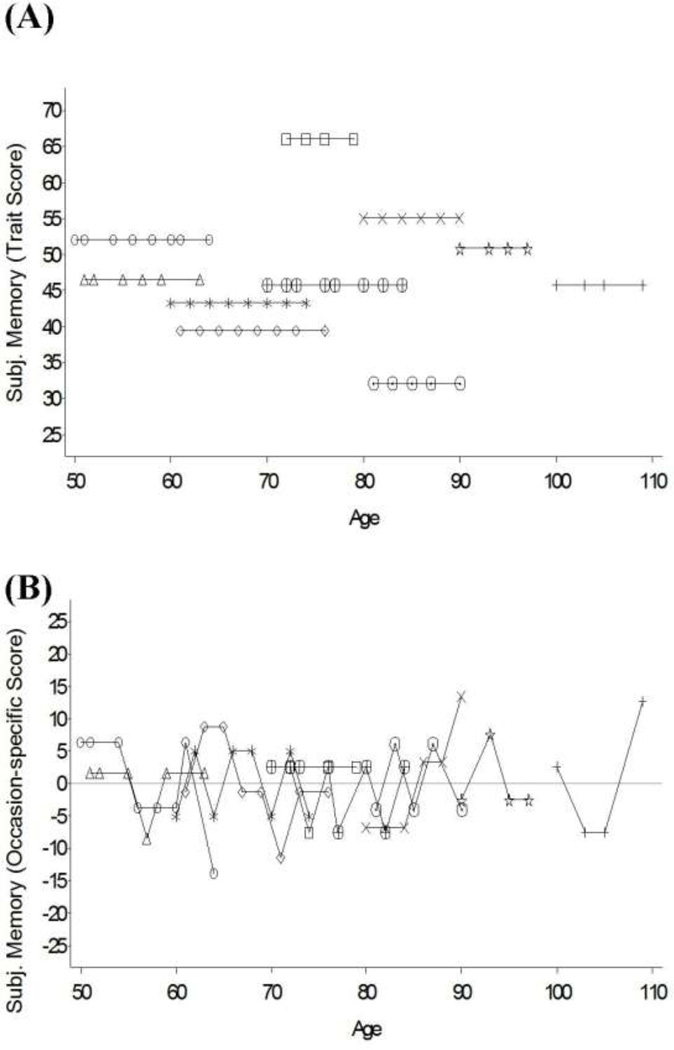
Figure 1.
Subjective memory scores from 10 participants used to illustrate how this variable can be separated into between-person components (trait score) and within-person components (occasion-specific score). Panel A shows the individual averages obtained by taking the mean across an individual’s time series and are time-invariant. Panel B shows the individual deviations obtained by subtracting the mean from each score across the time-series. The individual residuals represent time-varying deviations from the individual average and are centered at zero. Negative residuals indicate that at a given occasion an individual reported lower subjective memory than his or her own average. Data presented in T scores (M= 50 and SD= 10).

