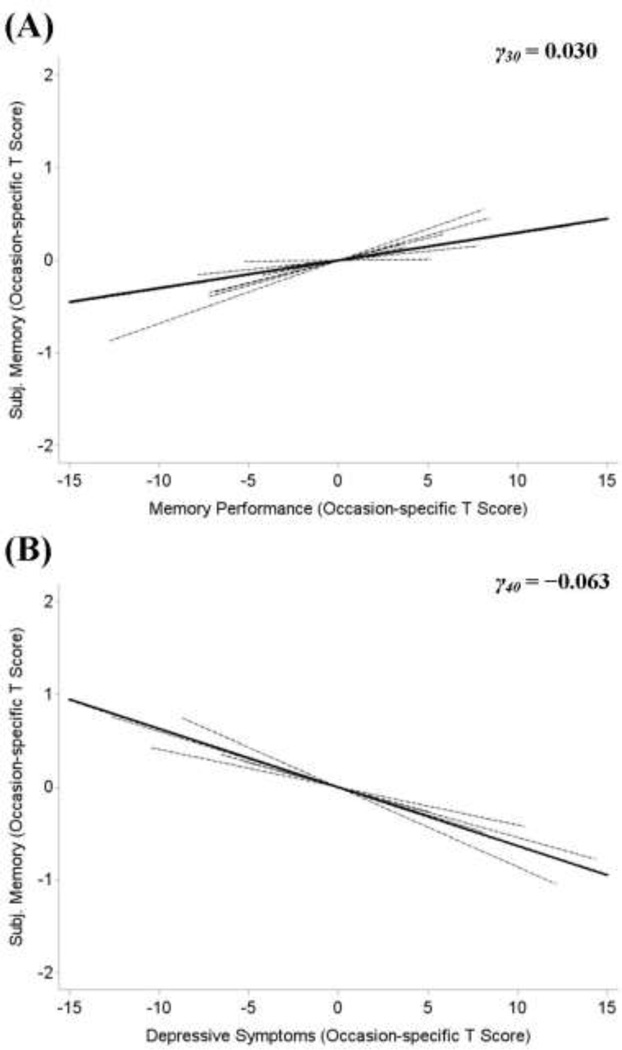
Figure 3.
Panel A shows the average within-person association of subjective memory and memory performance (solid line). The within-person relations of 10 participants are also plotted (dashed lines). On occasions when individuals scored higher than usual on a test of episodic memory, they also reported higher subjective memory than usual. Panel B shows the average within-person association of subjective memory and depressive symptoms (solid line) and the within-person relations of 10 participants (dashed lines). On occasions when individuals reported more than usual depressive symptoms, they also reported lower subjective memory than usual. Again, the figure also highlights the tremendous amount of between-person differences. Data presented in T scores (M= 50 and SD= 10).

