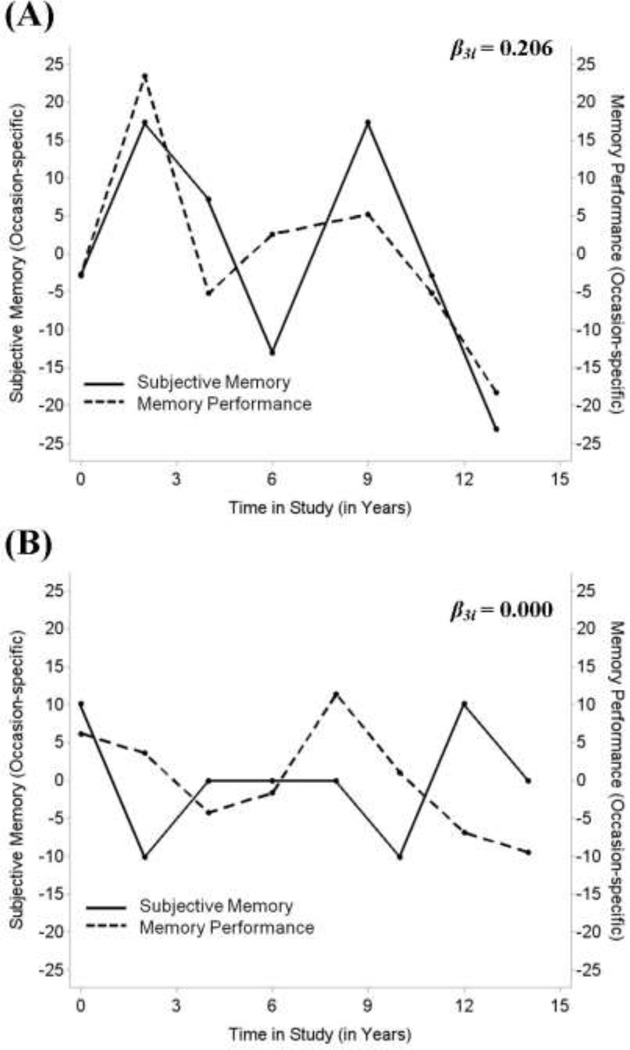
Figure 4.
Individual plots of within-person association between subjective memory (solid line) and memory performance (dashed line). Each plot represents an individual participant. Panel A illustrates a person with a positive within-person association (β2i = 0.206) that is well above the sample mean of γ20 = 0.030), indicating closely related subjective memory and memory performance. In contrast, Panel B shows a person with no within-person association between subjective memory and memory performance (β2i = 0.000).

