Figure 1.
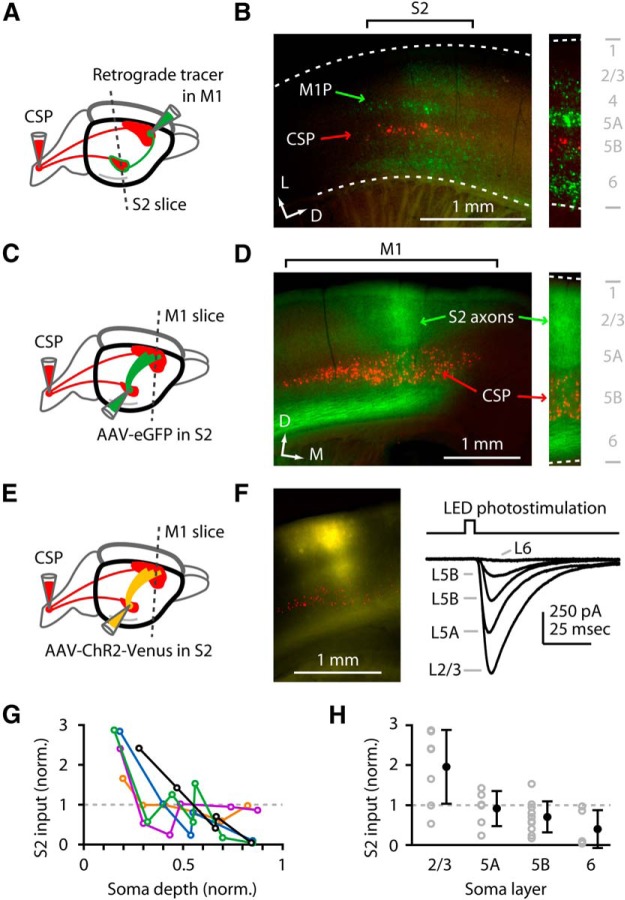
S2 axons monosynaptically excite M1 neurons across all layers. A, Labeling paradigm. Retrograde tracer injections were made in the spinal cord and M1, and S2 slices were examined for labeling of CSP (red) and M1-projecting corticocortical (M1P) neurons (green). B, Left, Epifluorescence image of labeling pattern in S2 slice. D, Dorsal; L, lateral. Right, Higher-magnification view of laminar distribution of retrogradely labeled neurons. WM, White matter. C, Labeling paradigm. Retrograde tracer was injected in the spinal cord, AAV-eGFP was injected in S2, and M1 slices were prepared to visualize S2 axons in M1. D, Left, Epifluorescence image, showing S2 axons (green) and CSPs (red) in M1. D, Dorsal; M, medial. Right, Higher-magnification image, showing S2 axons in all layers (green; arrows) overlapping with M1-CSPs (red; arrow). E, Labeling paradigm. Retrograde tracer was injected in the spinal cord, AAV-ChR2-Venus was injected in S2, and M1 slices were prepared to visualize and photostimulate S2 axons while recording from CSP and other M1 neurons. F, Left, Example epifluorescence image. Right, Example voltage-clamp traces of photo-evoked responses. Wide-field illumination with a gated LED was used to photostimulate the ChR2-expressing S2 axons (yellow) while recording from M1 neurons in different layers (layer 2/3, etc., as indicated). G, Laminar profiles from several slices, plotted together after normalization (to the mean input per slice). Soma depth was normalized: 0 = pia; 1 = white matter. The black profile corresponds to the example traces in G. H, Same data as in G, but with the values pooled across profiles by layer (gray) and averaged (black) (mean ± SEM).

