Figure 2.
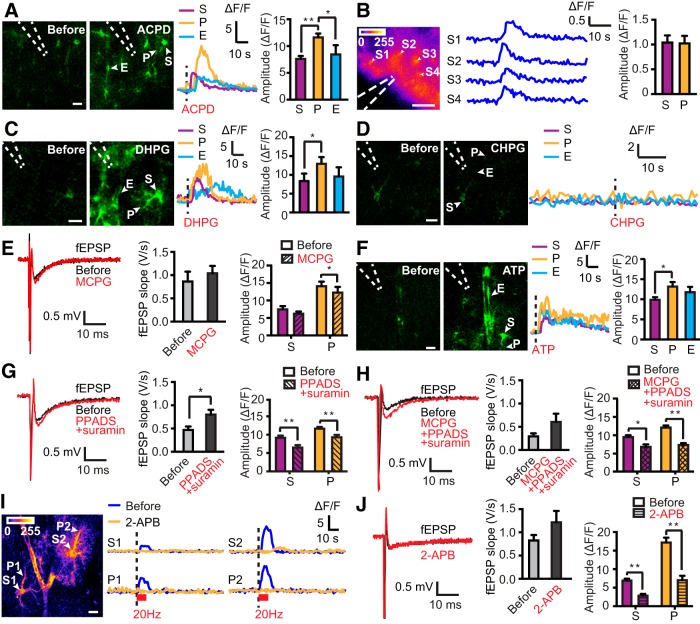
Astrocytic Ca2+ signals depend on mGluRs and purinergic receptors. A, Images of GCaMP5E fluorescence before and after ACPD delivery through a micropipette (dashed lines) into the acute hippocampal slice preparation. Scale bar, 10 μm. The fluorescence traces are from the astrocytic soma (S), process (P), and endfoot (E) as indicated. Bar diagram shows amplitudes [Kruskal–Wallis test with Dunn's post hoc test, n = 67 (somata), 86 (processes), and 20 (endfeet), 7 slices from 3 animals]. B, Astrocytic GCaMP5E fluorescence responses to ACPD microinjected into the hippocampus in vivo. SD image of fluorescent intensities (left) and individual traces (middle) of ΔF/F from astrocytic somata (S1–S4) during ACPD application (1 Hz frame rate). Dashed lines indicate position of delivery pipette. Scale bar, 100 μm. Right, Quantification of amplitude of ACPD-evoked astrocytic Ca2+ responses in somata (S) and processes (P) [unpaired t test, n = 32 (somata) and 25 (processes), 9 trials in 4 animals]. C, As in A but with DHPG [n = 30 (somata), 35 (processes), and 16 (endfeet), 8 slices from 4 animals]. D, Microinjection of CHPG into acute hippocampal slices failed to elicit astrocytic GCaMP5E fluorescence responses in five slices from four mice (16 somata, 25 processes, and 4 endfeet were analyzed). Shown are example traces before and after microinjection. Scale bar, 10 μm. E, Example fEPSPs and mean fEPSP slopes and astrocytic GCaMP5E fluorescence transients elicited by Scc stimulation before and after application of MCPG to the slice solution. Two-way ANOVA failed to reveal an effect of MCPG on Ca2+ signal amplitude, whereas the Wilcoxon's signed-rank test showed a significant amplitude reduction in astrocytic processes (P) (n = 34) but not in somata (S) (n = 37; 7 slices from 4 animals). F, As in A but with ATP [n = 36 (somata), 35 (processes), and 19 (endfeet), 3 slices from 2 animals]. G, As in E but with PPADS and suramin [n = 50 (somata) and 92 (processes), 10 slices from 6 animals]. H, As in E but with a mixture of MCPG, PPADS, and suramin [n = 30 (somata) and 51 (processes), 7 slices from 4 animals]. I, Baseline SD image of fluorescence intensities (1 Hz frame rate). Scale bar, 10 μm. Individual traces from somata and processes during 2-APB application. J, As in E but with 2-APB [n = 41 (somata) and 38 (processes), 8 slices from 4 animals; only transients with peak amplitude within 15 s after Scc stimulation are included]. Values are mean ± SEM. *p < 0.05, **p < 0.001.

