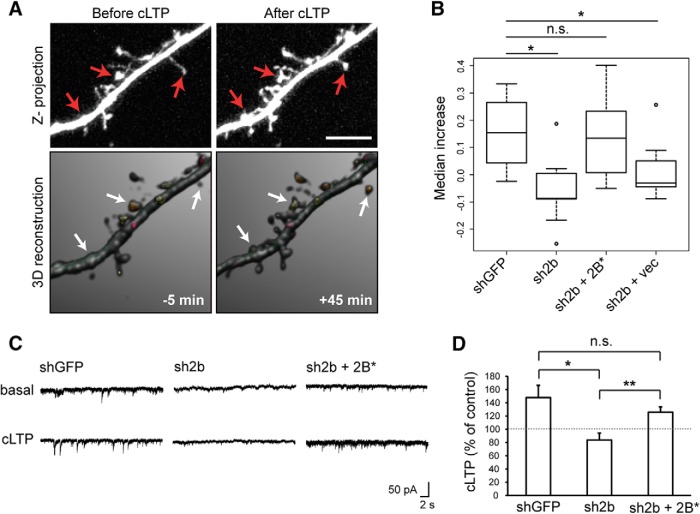
Figure 6.
Chmp2b is required for stable increase in spine volume and in synaptic efficacy during chemical LTP. A, B, Hippocampal neurons were transfected with pSuper-mCherry and rescue plasmids. Confocal image stacks of dendritic segments (visualized by mCherry fluorescence) were acquired before and after induction of cLTP. 3D models of dendritic morphology were built from the stacks with NeuronStudio and used to measure changes in spine volume. A, Maximal intensity projection of confocal images (top) and 3D models (bottom) of a representative dendritic segment before and after cLTP in a neuron transfected with control plasmid. Arrows indicate spines that have expanded. B, The percentage increase in spine volume was measured for each stable spine of a segment 5 min before and 45 min after cLTP induction, and median increases were calculated per transfected neuron. The box plot shows the distribution of median increases in neurons transfected as indicated (n = 8–9 neurons per condition, 50–100 spines per neuron). vec, Vector expressing GFP alone. The spines of control neurons were significantly expanded after cLTP induction (p = 0.0075, Wilcoxon one-sample test). The increase was abolished by Chmp2b knockdown (*p = 0.011 compared with control, Wilcoxon test with Holm correction) and reinstated by expression of Chmp2b* (p = 0.336 compared with control), but not by GFP alone (p = 0.041 vs control). C, D, Hippocampal neurons were transfected at 18 DIV with the indicated plasmids and cLTP was induced as in A. mEPSCs were recorded before and after cLTP induction by patch-clamp recording in the whole-cell configuration. C, Sample traces obtained before and after cLTP in neurons transfected as indicated. D, The histogram shows the relative potentiation of mEPSCs (mean percentage increase per neuron) compared with the mean amplitude before cLTP. The dotted line indicates 100% of basal amplitude (mean mEPSC amplitude before LTP). LTP was abolished in Chmp2b-deprived neurons (*p = 0.033 compared with control, Holm-corrected t test). Expression of Chmp2b* rescued LTP (p = 0.046 compared with basal amplitude in the same cells, paired t test; **p = 0.0062 vs nonrescued cells; p = 0.34 vs control cells, two-sided t tests). Control, n = 5 cells; Chmp2b shRNA plus vector, n = 11 cells; Chmp2b shRNA plus Chmp2b*WT, n = 9 cells.

