Figure 3.
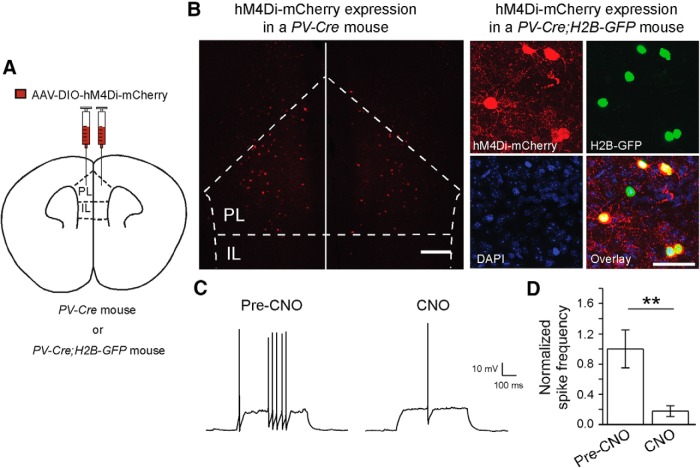
Selective suppression of PL PV interneurons with a pharmacogenetic approach. A, A schematic of injection. B, Left, A representative image of infected neurons in the PL region. Scale bar, 200 μm. Right, Representative images showing selective expression of hM4Di-mCherry (red) in PL PV interneurons, which were labeled with H2B-GFP (green). Scale bar, 50 μm. C, Sample recording traces showing the effect of CNO bath application (10 μm) on the spiking activity of mPFC PV neurons expressing hM4Di-mCherry. D, Quantification of the effect of hM4Di activation on PV cell firing. The firing rate of each neuron was normalized to the pre-CNO mean firing rate. CNO application significantly reduced PV cell firing rate (n = 6 cells/3 mice; t(5) = 4.1; **p < 0.01, paired t test). Data are shown as mean ± SEM.

