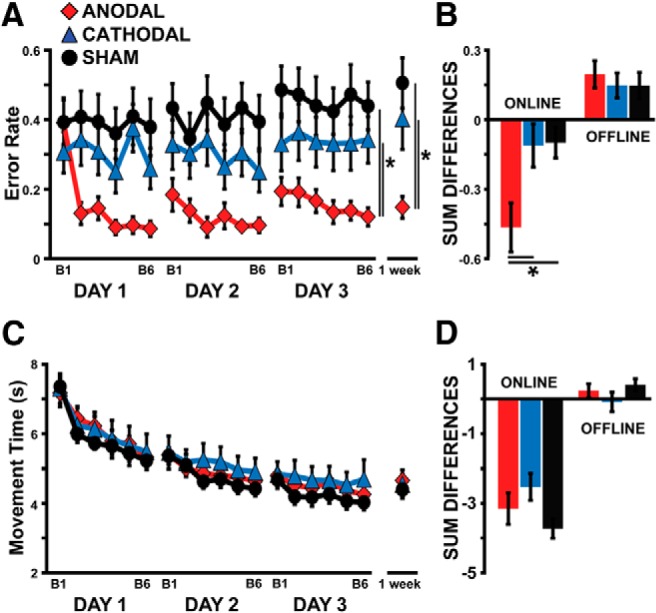
Figure 3.

Error rate versus movement time. Red diamonds are the average performances of the Anodal group. Blue triangles represent the Cathodal group. Black circles denote the Sham group. A, y-axis represents the error rate and x-axis denotes training blocks across days. Despite all subjects having similar error-rate levels at the beginning of the study, those in the Anodal group improved their accuracy beyond the levels achieved by the subjects in the Cathodal and Sham groups. B, The bar graph shows group averages of the error rate for the sum of on-line and off-line changes. Subjects with anodal stimulation showed larger improvements in on-line changes compared with Cathodal and Sham groups. C, y-axis represents movement time and the x-axis represents training blocks across days. All groups showed similar improvements in movement time across training blocks. D, The bar graph shows group averages of movement time for the sum of on-line and off-line changes. All groups showed similar changes in on-line and off-line effects. Data are means ± SEM. *p ≤ 0.05.
