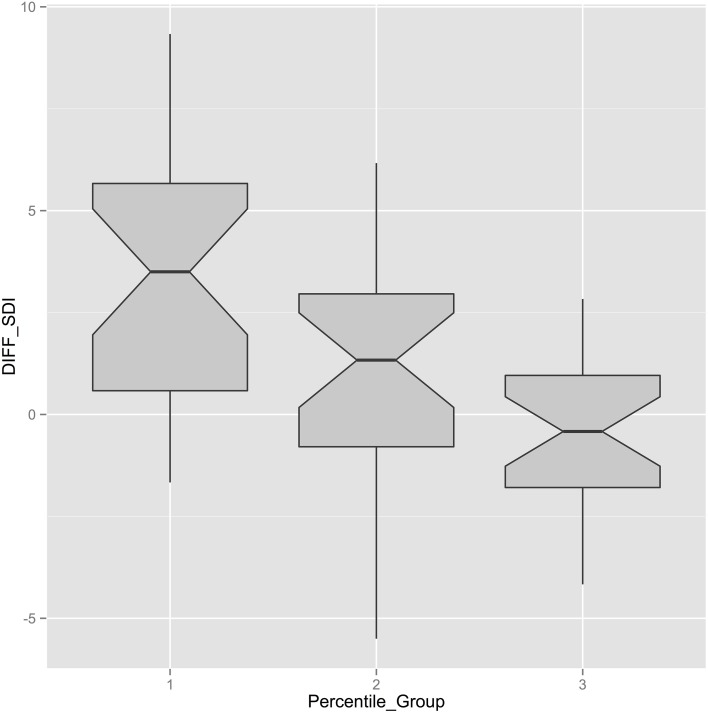
Figure 4.
Boxplots displaying the difference in SDI-measures in FoWo and NuT (diffSDI) with respect to the three percentiles in the classroom. It can clearly be seen that the difference in SDI is considerably higher in the first percentile of SDINuT and is constantly decreasing with the higher thirds.

