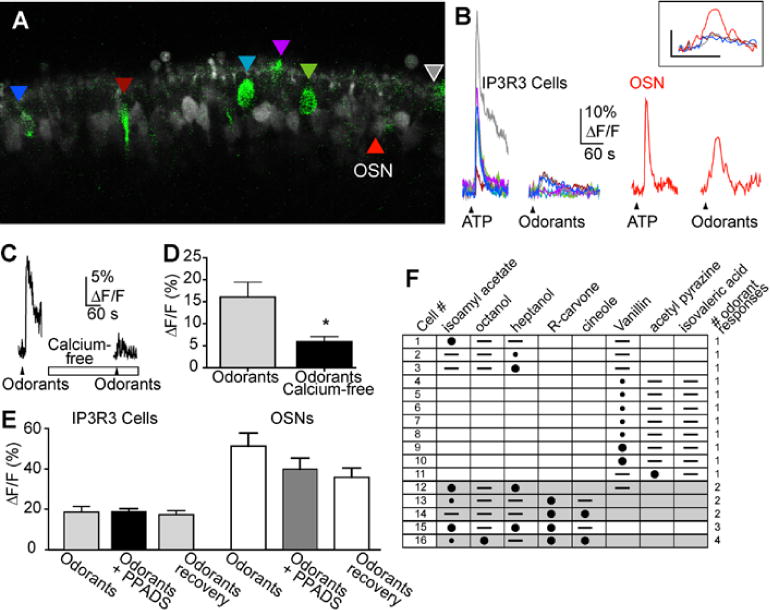
Fig. 9.

Odorant responses from IP3R3 MV cells. (A) Representative X-Rhod 1 AM loaded MOE slices containing IP3R3 MV cells (green). The GFP and X-Rhod 1 channel settings have been modified from data acquisition settings to improve visibility of the IP3R3 MV cells. Colored triangles indicate the IP3R3 MV cells analyzed and correspond to the colored traces shown in B. (B) Time course of Ca2+ transients in response to ATP (10 μM) and a mixture of odorants (10 μM each cineole, octanol, heptanol, isoamyl acetate and R-carvone) from outlined IP3R3 MV cells (left) and an OSN (right). Black triangles correspond to time of drug superfusion. Breaks in traces correspond to ~5 minutes when images were not collected. Inset: Expanded time course of the odorant-induced calcium transient from the OSN (red trace) and the 3 odorant-responsive IP3R3 MV cells. (C) Representative odorant mixture-induced calcium transient from an IP3R3 MV cell in normal and calcium-free Ringer’s solution (superfusion indicated by open rectangle). Black triangles correspond to time of drug superfusion. (D) Average peak calcium transient amplitudes are shown (mean ± s.e.m.) (n = 8 cells from 3 slices, t7=2.53, P<0.04, Student’s t-test). (E) Average peak calcium transient amplitudes induced by ATP, ATP in the presence of P2 receptor antagonist PPADS, or following washout of PPADS (recovery) from IP3R3 MV cells (left) and OSNs (right) are shown (mean ± s.e.m; t18 = 0.020, P = 0.98, n=10 cells from 3 slices and t12 = 1.33, P = 0.2, n=7 OSNs from 3 slices, Student’s t-test). (F) Matrix of 16/55 cells from 7 slices that responded to odorants singly superfused (50 μM). Large black circles indicate ΔF/F >10%, small black circle indicates 5–10% ΔF/F, – indicates no response to odorant, lack of symbol indicates odorant was not superfused.
