
Figure 1.
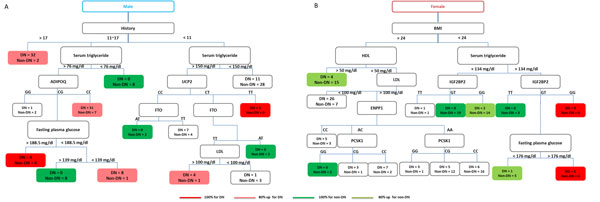
Decision tree classification of diabetic nephropathy among male and female type 2 diabetics. Accuracy measures are represented by the color intensity. Red indicates 100% prediction accuracy for DN. Pink indicates a prediction accuray above 80% but below 100% for DN. Green indicates 100% prediction accuracy for non-DN. Light green indicates a prediction accruacy above 80% but below 100% for non-DN.