
Figure 3.
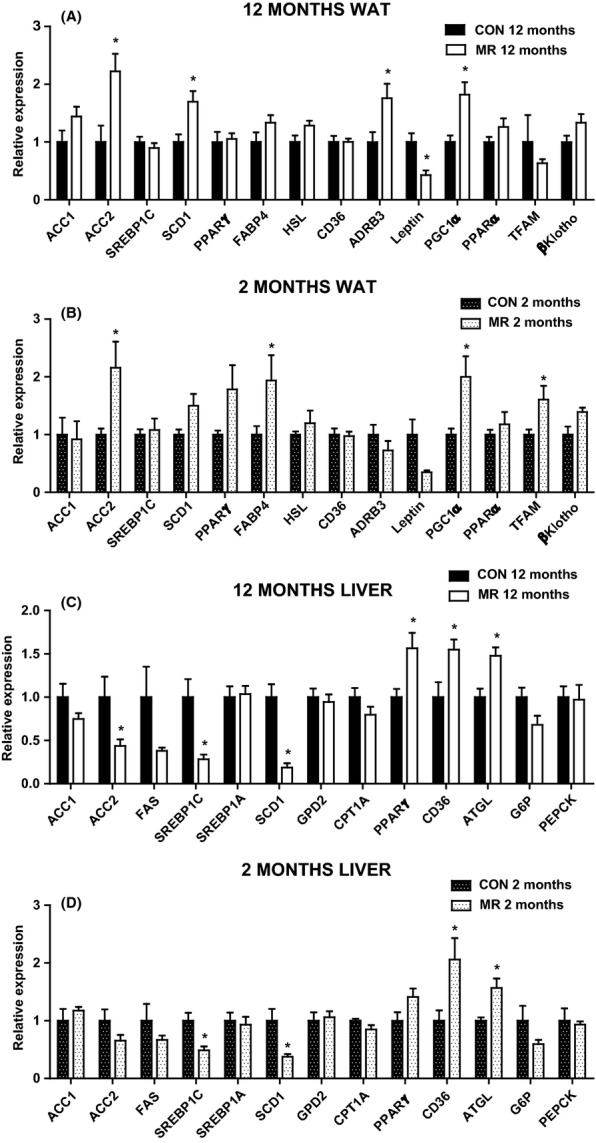
Epididymal white adipose tissue (WAT) and hepatic gene expression in mice on methionine restriction (MR) and control diet. Gene expression was measured by qPCR in (A) epididymal WAT in 12-month-old mice (n = 5–6), (B) epididymal WAT in 2-month-old mice (n = 4–6), (C) liver in 12-month-old mice (n = 5–8) and (D) liver in 2-month-old mice (n = 4–6) fed MR or control diet. Data were analyzed as fold change relative to control-fed mice. Significance was calculated between MR and control diet by two-tailed Student’s t-test (*P < 0.05). Data are represented as mean ± SEM. Black bars, 12-month-old control-fed mice; white bars, 12-month-old MR-fed mice; black hatch bars, 2-month-old control-fed mice; white hatch bars, 2-month-old MR-fed mice.