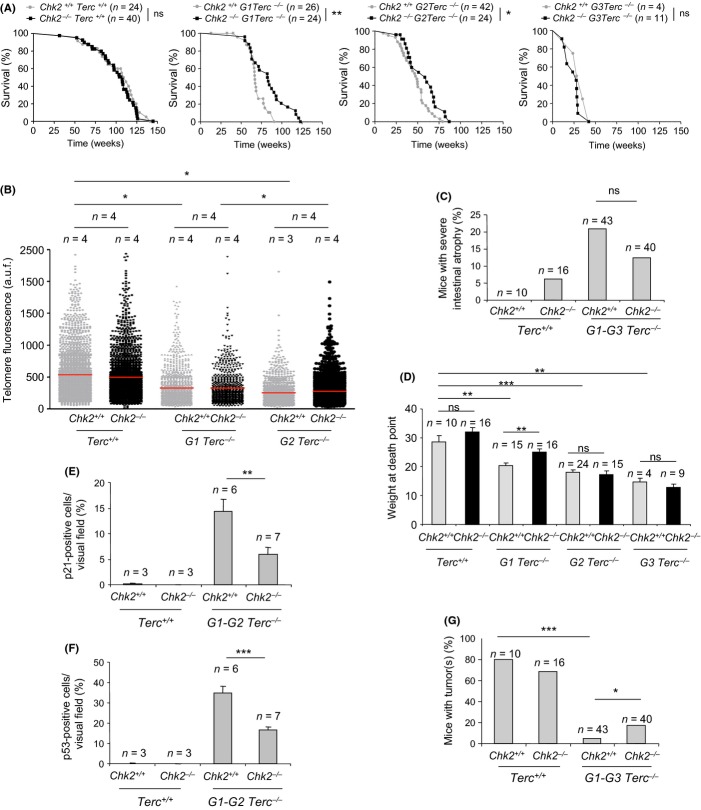
Figure 3.
Chk2 deficiency improves mouse survival, intestinal degenerative pathologies, and body weight of G1-G2 Terc-deficient mice (A) Survival curves of G1-G3 Terc/Chk2 mouse cohorts. Statistical analysis was done by the Log-rank (Mantel–Cox) test. ns, no significant; *P < 0.05; **P < 0.01. (B) Telomere length analysis by q-FISH in the intestine of G1-G3 Terc/Chk2 mouse cohorts. (C) Quantification of severe intestinal degenerative lesions in Terc+/+ and G1-G3 Terc−/− in Chk2-proficient and deficient background at death point. (D) Body weight of G1-G3 Terc/Chk2 mouse cohorts at death point. (E–F) Percentage of p21-positive (E) and p53-positive cells (F) in the intestinal crypts of the indicated G1-G2 Terc/Chk2 mouse cohorts. (G) Percentage of mice that presented malignant tumors among G1-G3 Terc/Chk2 cohorts at death point. T-Test was performed for statistical analysis in B, D, and E. Chi-square was performed for statistical analysis in F. Error bars represent standard error. *P < 0.05; **P < 0.01; ***P < 0.001. n, number of mice of each genotype.

