
Figure 6.
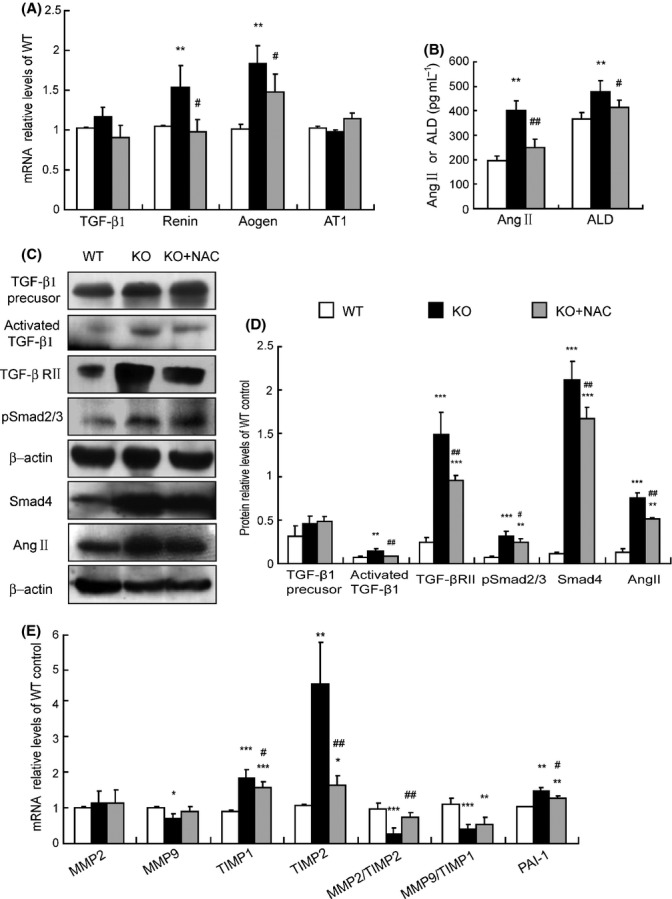
Activation of TGF-β signaling and imbalance between ECM synthesis and degradation were ameliorated by N-acetylcysteine (NAC) treatment in Bmi-1-/- mice. (A) Transforming growth factor-β1 (TGF-β1), renin, angiotensinogen (aogen), angiotensin II (Ang II) receptor type 1 (AT1) mRNA relative levels in kidneys demonstrated by real-time RT–PCR, calculated as a ratio to GAPDH mRNA, expressed relative to WT. (B) Plasma Ang II and aldosterone (ALD) levels measured by radioimmunoassay. (C) Western blots of kidney extracts for expression of TGF-β1 precursor, activated TGF-β1, transforming growth factor-β receptor II (TGF-βRII), pSmad2/3, Smad4, Ang II. β-actin was the loading control. (D) The above protein levels relative to β-actin protein levels were assessed by densitometric analysis. (E) Matrix metalloproteinases 2 (MMP2), MMP9, tissue inhibitor of metalloproteinase 1 (TIMP1), TIMP2, ratios of MMP2/TIMP2, MMP9/TIMP1, and plasminogen activator inhibitor-1 (PAI-1) mRNA relative levels in kidneys demonstrated by real-time RT–PCR, calculated as a ratio to GAPDH mRNA, expressed relative to WT. Values are means ± SEM of six determinations of each group. *P < 0.05; **P < 0.01; ***P < 0.001 compared with WT. #P < 0.05; ##P < 0.01 compared with KO.