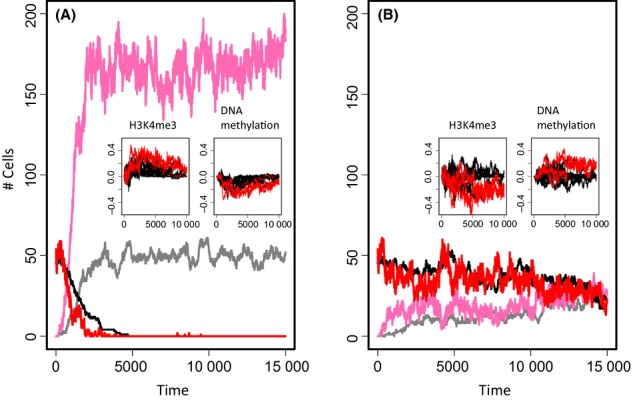
Figure 3.

Age-related phenotype feedback on epigenetic states. (A) Simulated cell numbers for decreased differentiation rate q (DNOVO = 0.3, TS = 2). Shown are cell numbers in α (black: young, gray: old) and in Ω (red: young, pink: old). (B) Simulated cell numbers for decreased proliferation rate R (DMAIN = 0.8, TS = 2). Colors as in A. Inserts: Differences in histone and DNA methylation between systems without and with ARP. Changes in phenotype controlling genes (red) and other C1a-genes (black) are shown as averages over all cells of the system. (A) In case of a dominant ARP, aging of all C1a-genes becomes accelerated, that is, histone modification (DNA methylation) in the system without a phenotype is larger (smaller) compared to the system with an ARP. (B) In case of a recessive ARP, aging becomes selectively retarded in C1a-genes controlling the ARP but not in the other C1a-genes.
