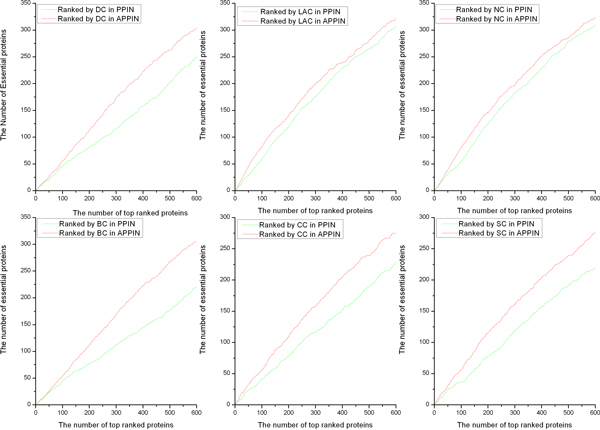
Figure 2.

DC, BC, CC, SC, LAC and NC are compared in two different networks by a jackknife methodology. To further illustrate the efficiency of our strategy, we have analyzed by using a jackknife methodology. In Fig.2, proteins are ordered in descending according to their scores. The curve is plotted with the cumulative counters of true essential proteins and the cumulative counters of predicted essential proteins.
