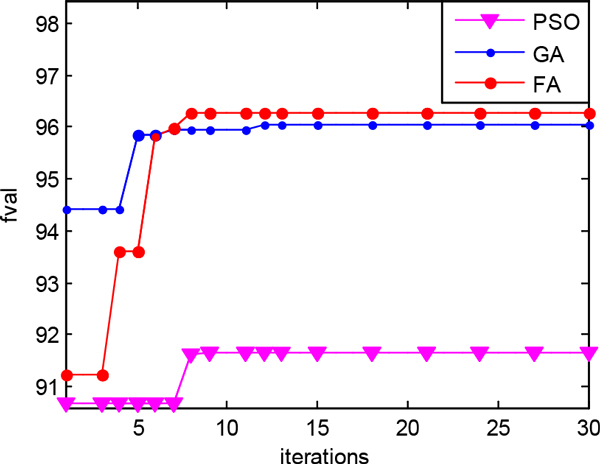
Figure 3.

Plots of the optimal objective function value with the number of iterations of the FA, PSO and GA. (a) Comparison of precision value (b) Comparison of recall value (c) Comparison of f-measure value

Plots of the optimal objective function value with the number of iterations of the FA, PSO and GA. (a) Comparison of precision value (b) Comparison of recall value (c) Comparison of f-measure value