
Figure 5.
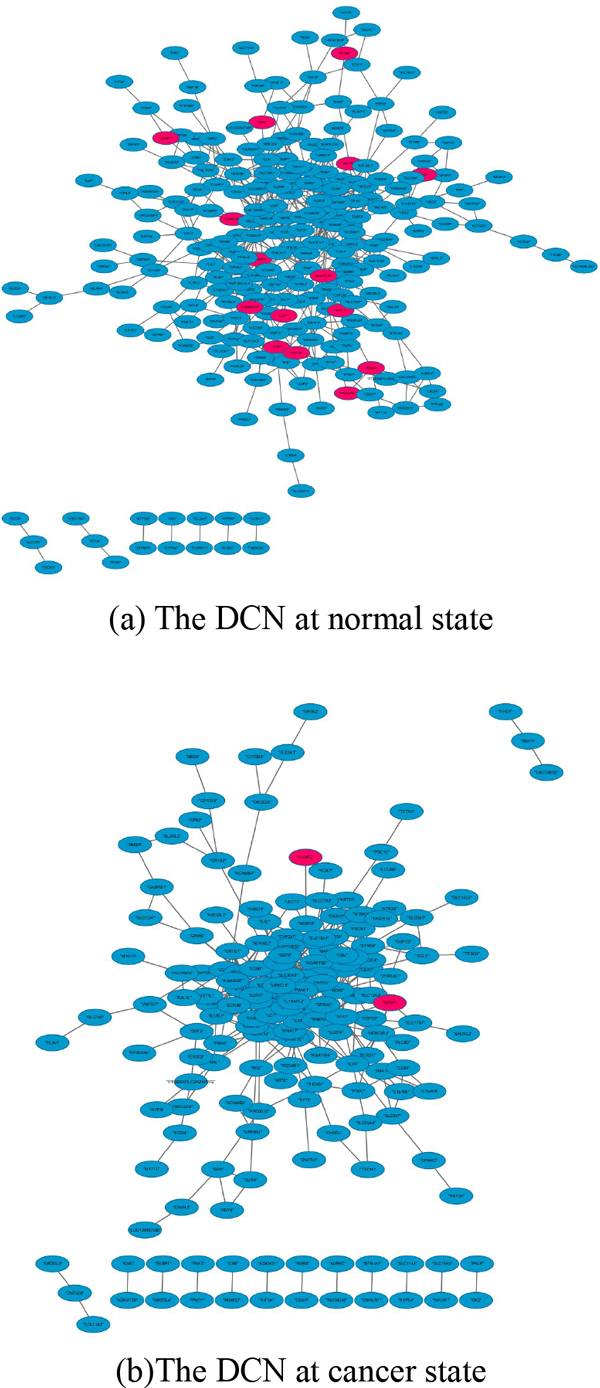
Two DCNs at normal and cancer state cancer. The blue ellipses represent down-regulated DEGs and the red ellipses represent up-regulated DEGs. Comparing with the normal DCN, in the cancer DCN, the up-regulated DEGs decrease. In additional, the structure of two differential DCNs change a lot.