
Figure 7.
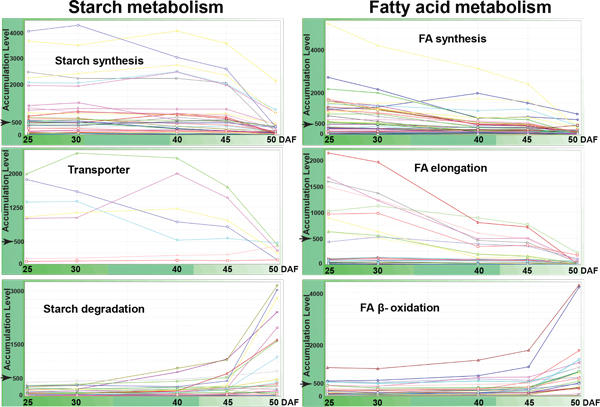
Interactive bio-statistical integration of complex datasets reveal metabolic changes associated with seed composition. Starch metabolism and fatty acid metabolism. The transcript levels for the genes in each pathway are visualized in MetaOmGraph http://www.metnetdb.org/MetNet_MetaOmGraph.htm. The data were normalized to a target signal intensity level of 500 for each chip.