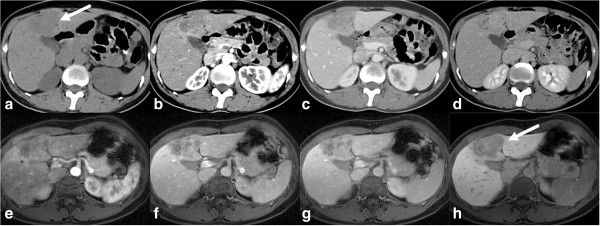
Figure 3.

CT and MRI appearances of mass forming type of iCCA. Top row: non contrast enhanced (a), post contrast enhanced arterial phase (b), portal venous phase (c) and delayed phase (d) CT images. Bottom row: post contrast enhanced MRI images in arterial phase (e), portal venous phase (f), delayed phase (g), and 20-minute delay post Gd-EOB-DTPA image (h). The mass is iso- to hypodense to liver and shows similar contrast enhancement characteristics on both CT and MRI with peripheral rim like arterial phase enhancement with centripetal enhancement in the portal venous and delayed phases without any washout. In the hepatobiliary phase there is no uptake of Gd-EOB-DTPA by the mass suggesting a non-hepatocellular tumor.
