Figure 1.

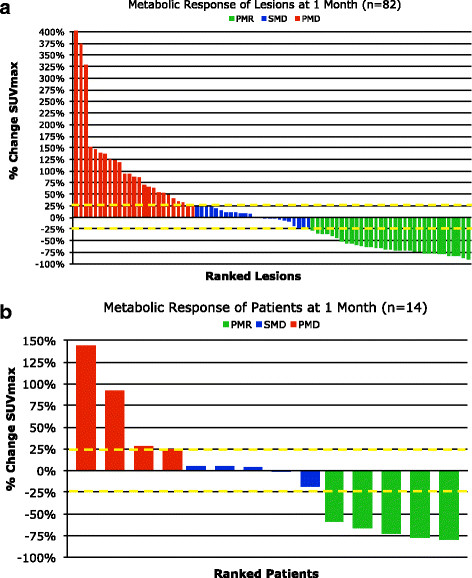
Waterfall plots of metabolic response by lesion (a) and patient (b). Three subjects were classified as PMD based on the presence of new lesions rather than % change SUVmax & have not been included in the waterfall plot above.

Waterfall plots of metabolic response by lesion (a) and patient (b). Three subjects were classified as PMD based on the presence of new lesions rather than % change SUVmax & have not been included in the waterfall plot above.